TABLEAU PORTFOLIO
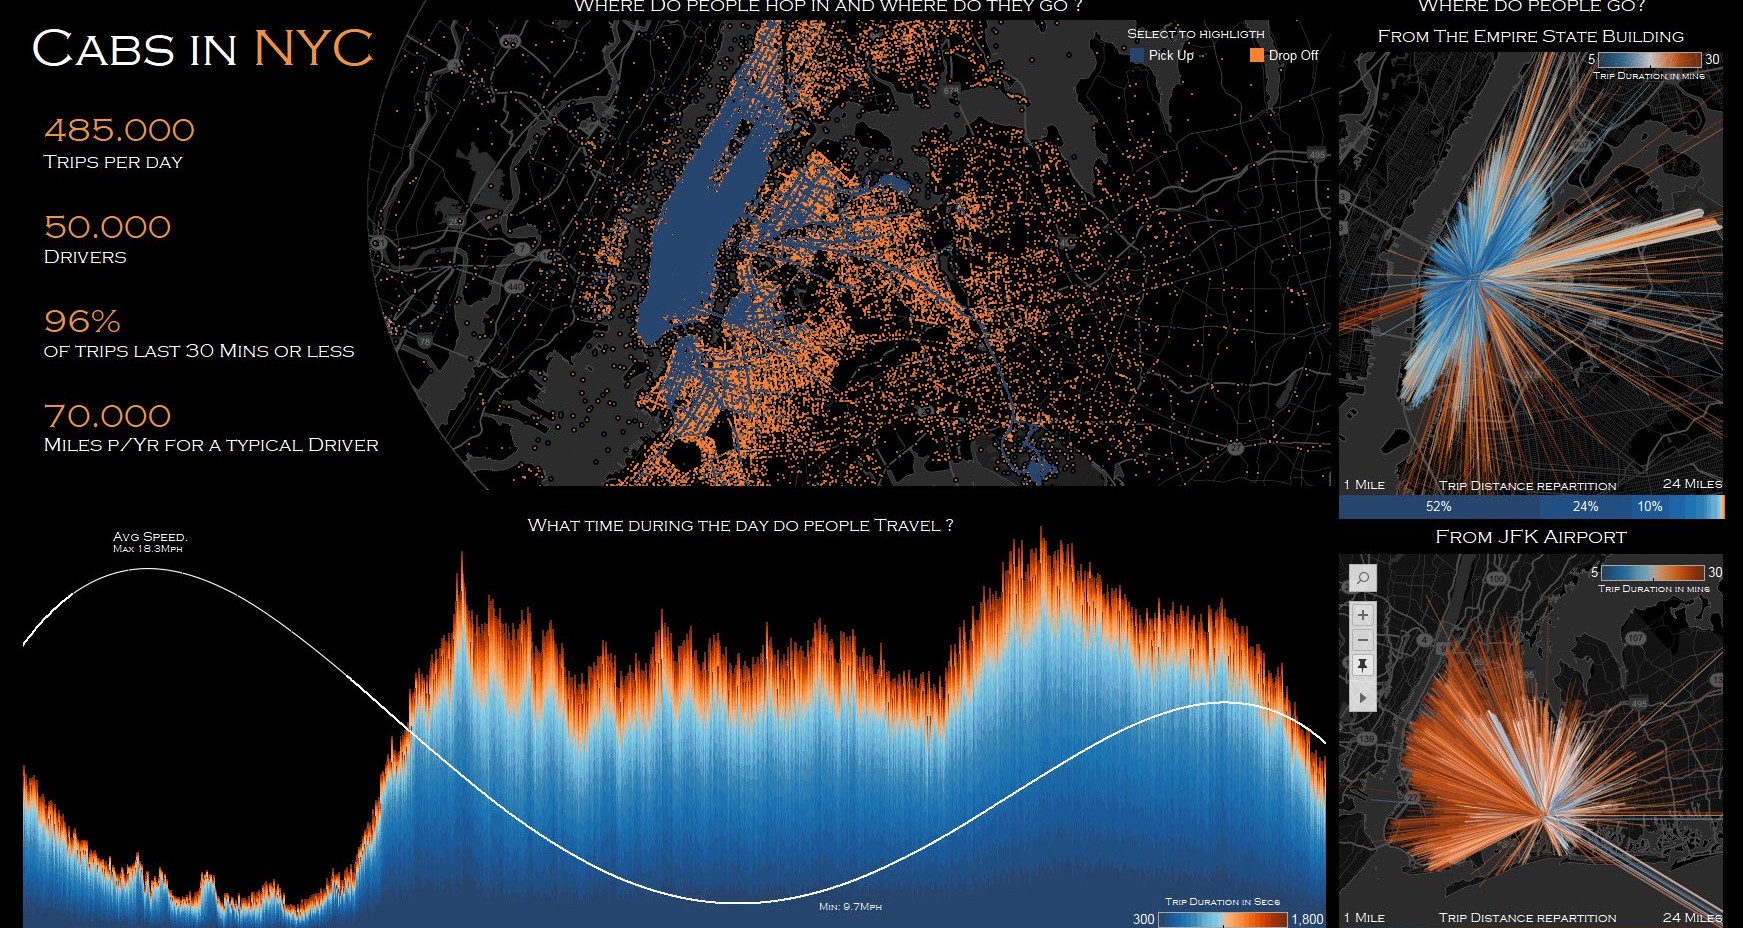
Cabs in NYC
Want an idea about where cabs go in NYC? Get an understanding of peak and off-peak traffic in Manhattan. This Viz was Viz of the Day in November 2015 and has over 50,000 views.
Go to the Viz.
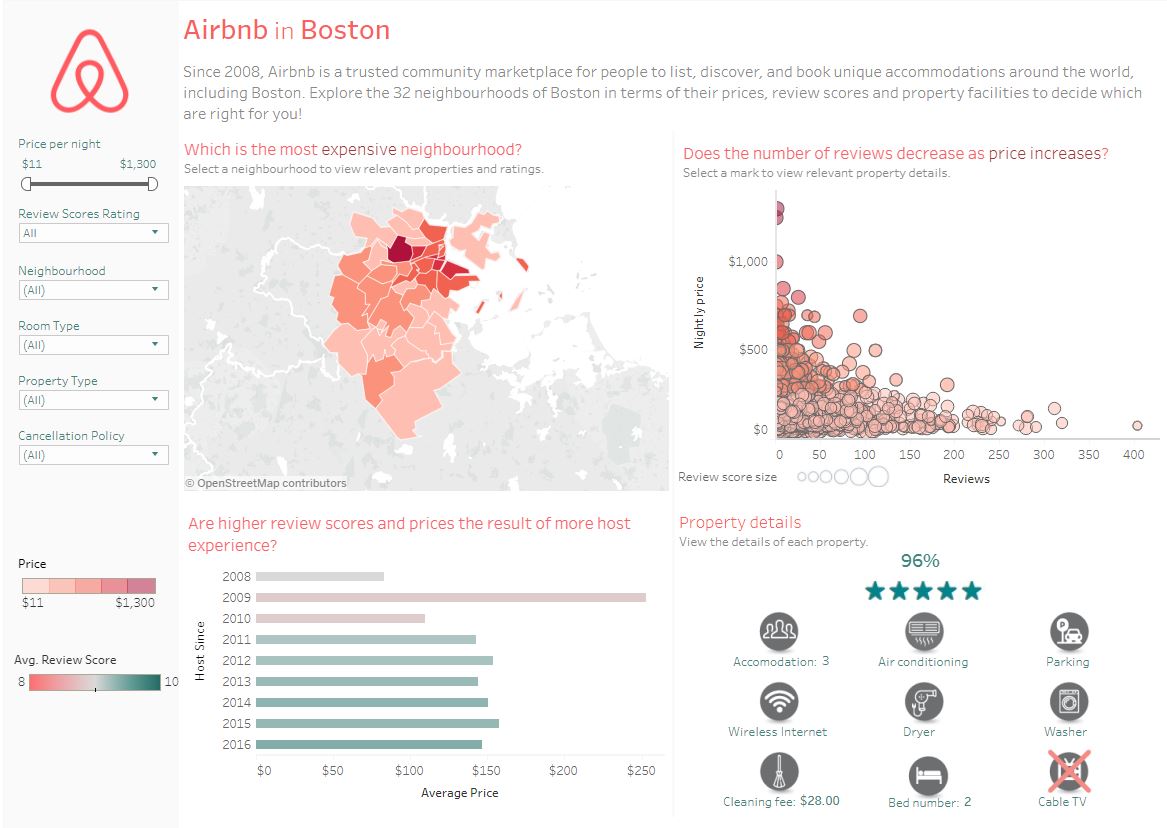
AirBnb in Boston
Explore the 32 neighbourhoods of Boston in terms of their prices, review scores, and property facilities.
Go to the Viz.
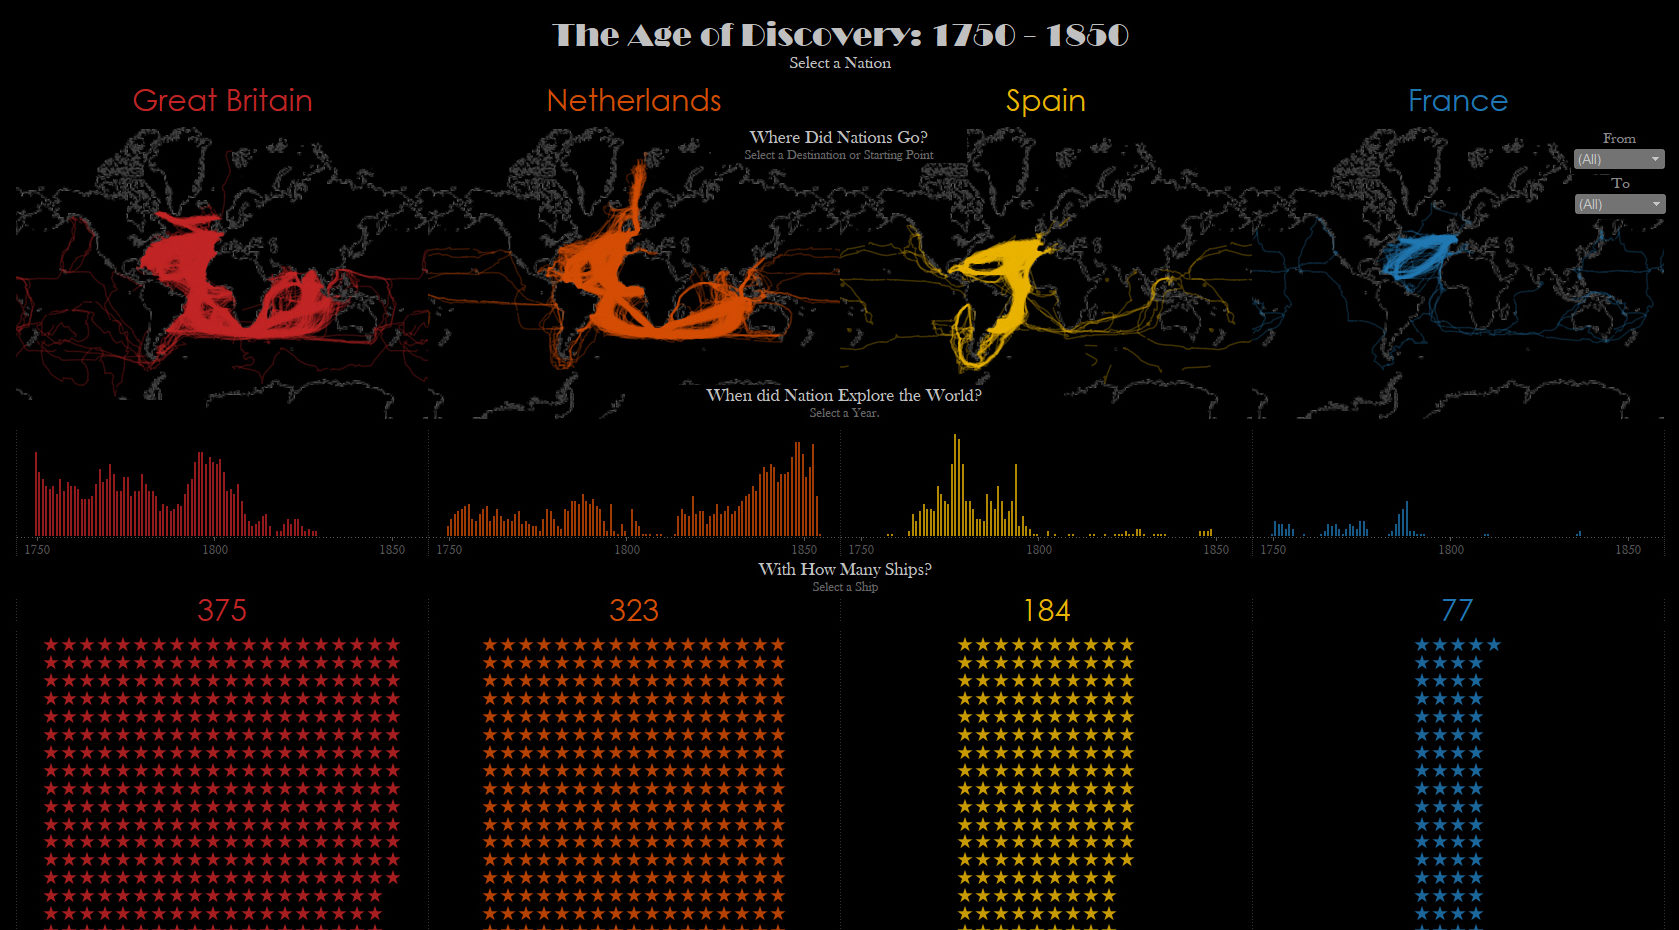
The Age of Discovery
Get a vision of the numerous and dangerous explorations the European explorers undertook during the Age of Discovery.
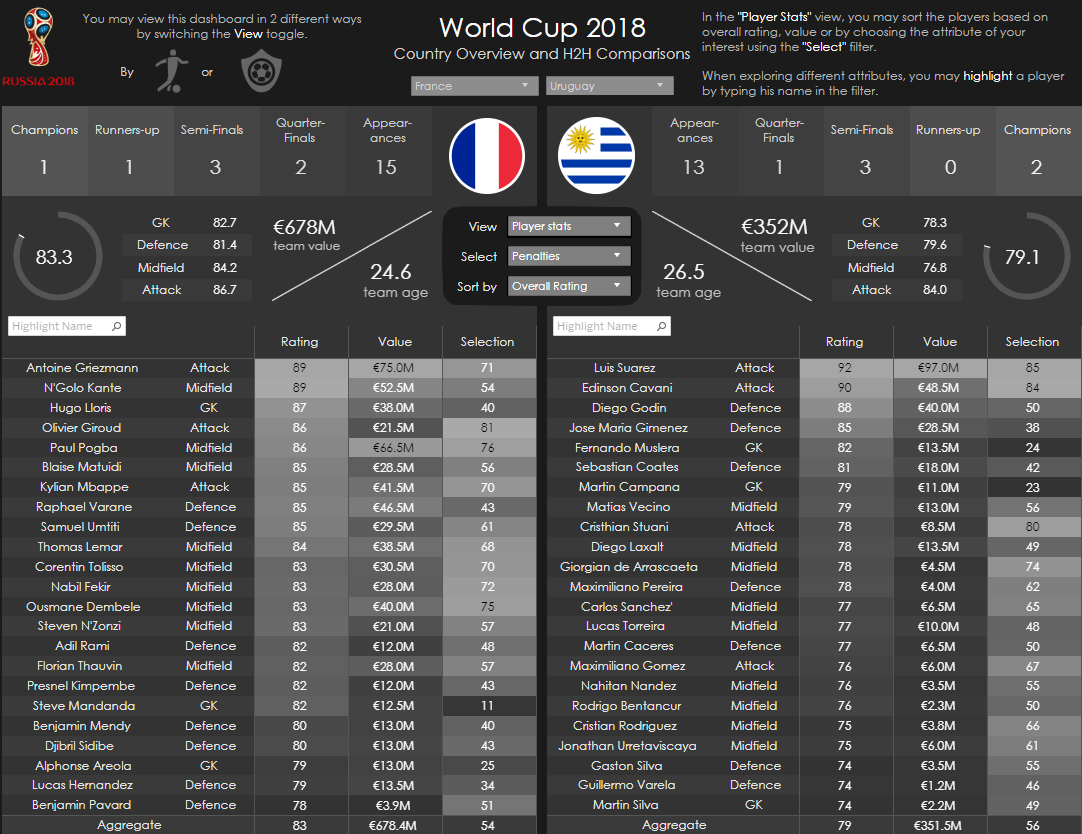
FIFA World Cup Russia 2018
Compare the teams competing in the 2018 FIFA World Cup and explore the statistics of each player participating in the tournament.
Go to the Viz.
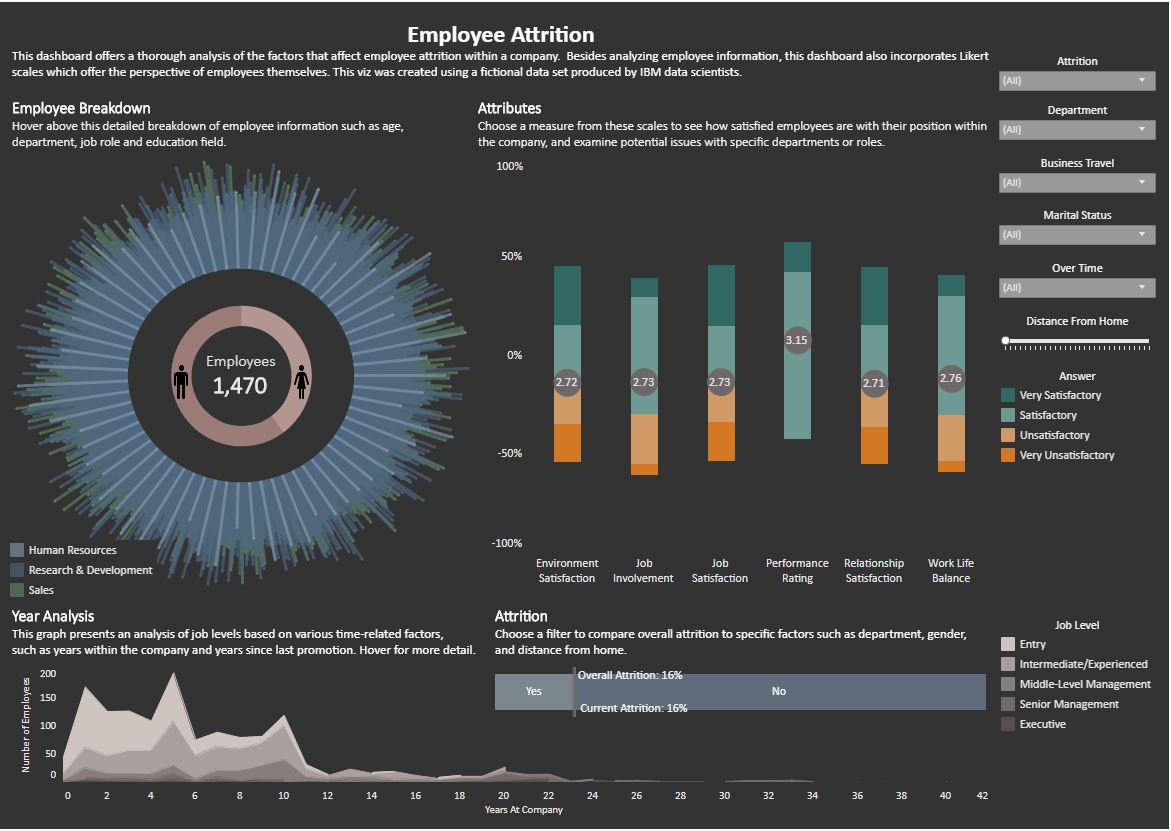
Employee Attrition
A thorough analysis of the factors that affect employee attrition within a company utilising a dashboard that also incorporates Likert scales, which offer the perspective of employees themselves.
Go to the Viz.
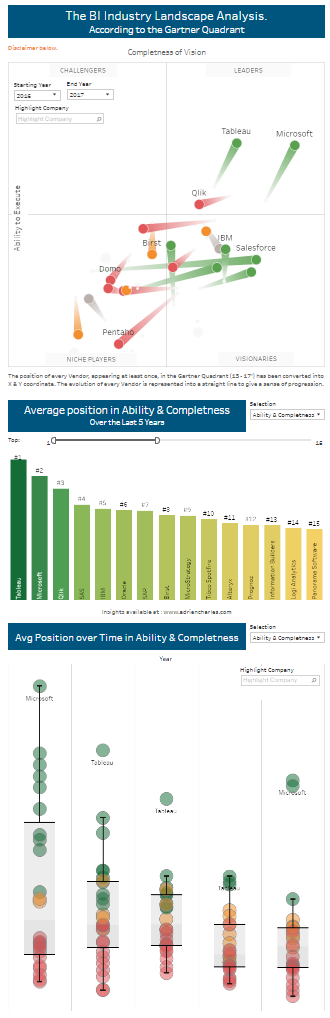
Gartner 2017
Analyse 5 years of Gartner Data with this viz. Which Vendor is doing the best?
Go to the Viz
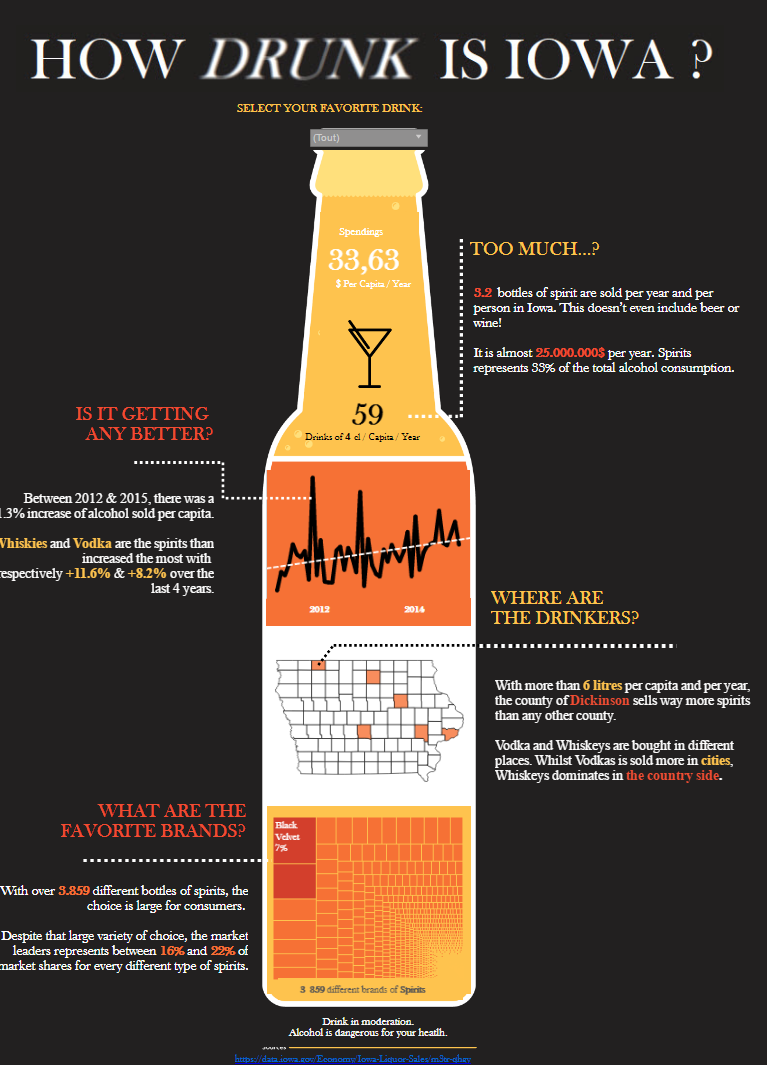
Alcohol in Iowa
Better understand the alcohol consumption in the State of Iowa.
This Viz was Viz of the day in February 2016.
Go to the Viz
100M Olympic Race
Compare all the sprinters from the Olympics in one race. An Imaginary Race between Usain Bolt and all other runners.
Go to the Viz
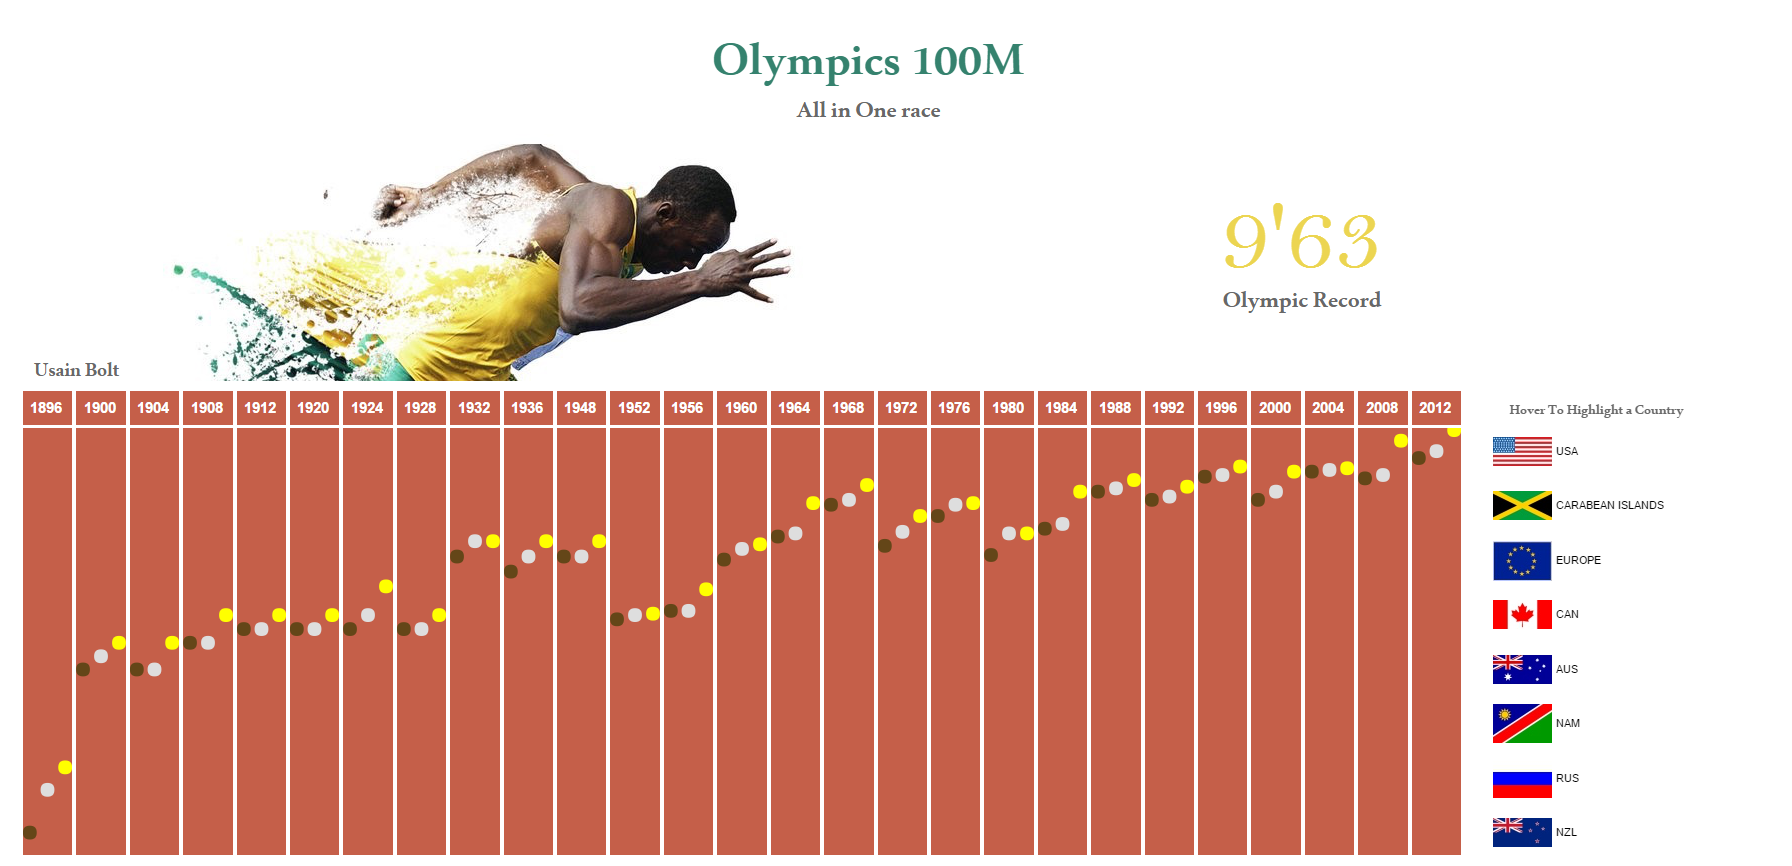
Tableau Voice Controller
Control your data with your voice. A simple list of vocal commands allows you to control your dashboards and Tableau views.
Check it out.

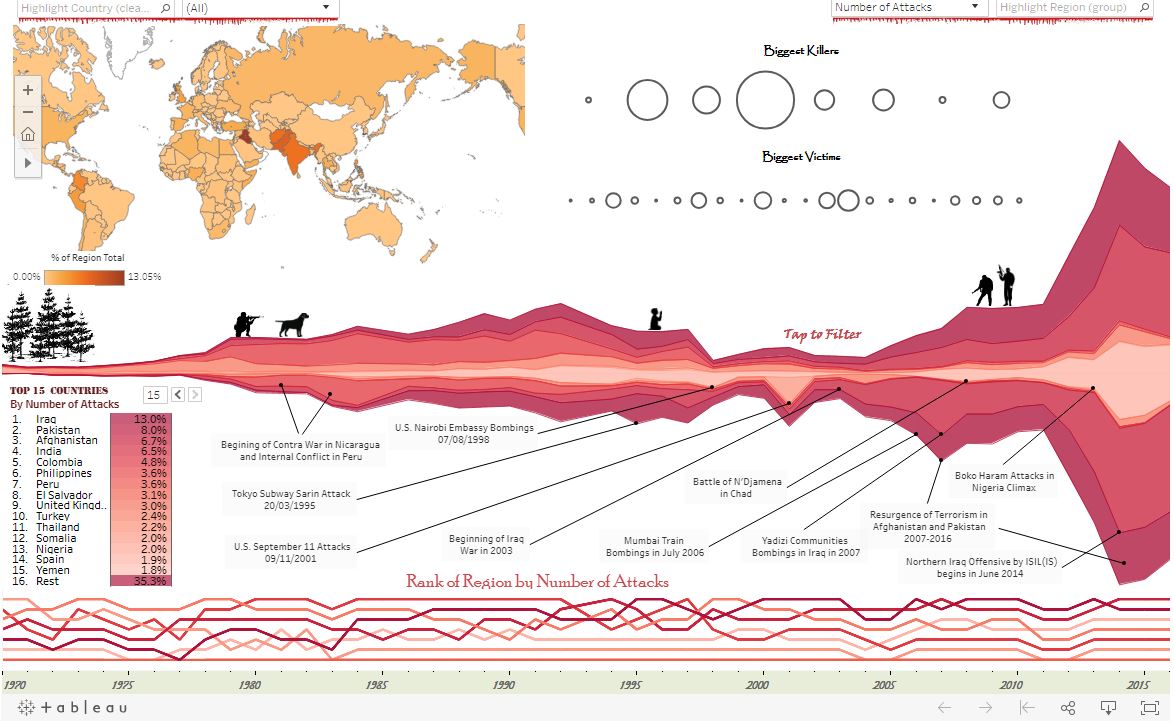
Global Terrorism (1970-2016)
Dig deeper into the regional trends in global terrorism between 1970 and 2016. What insights can we gain from these?
Go to the Viz.
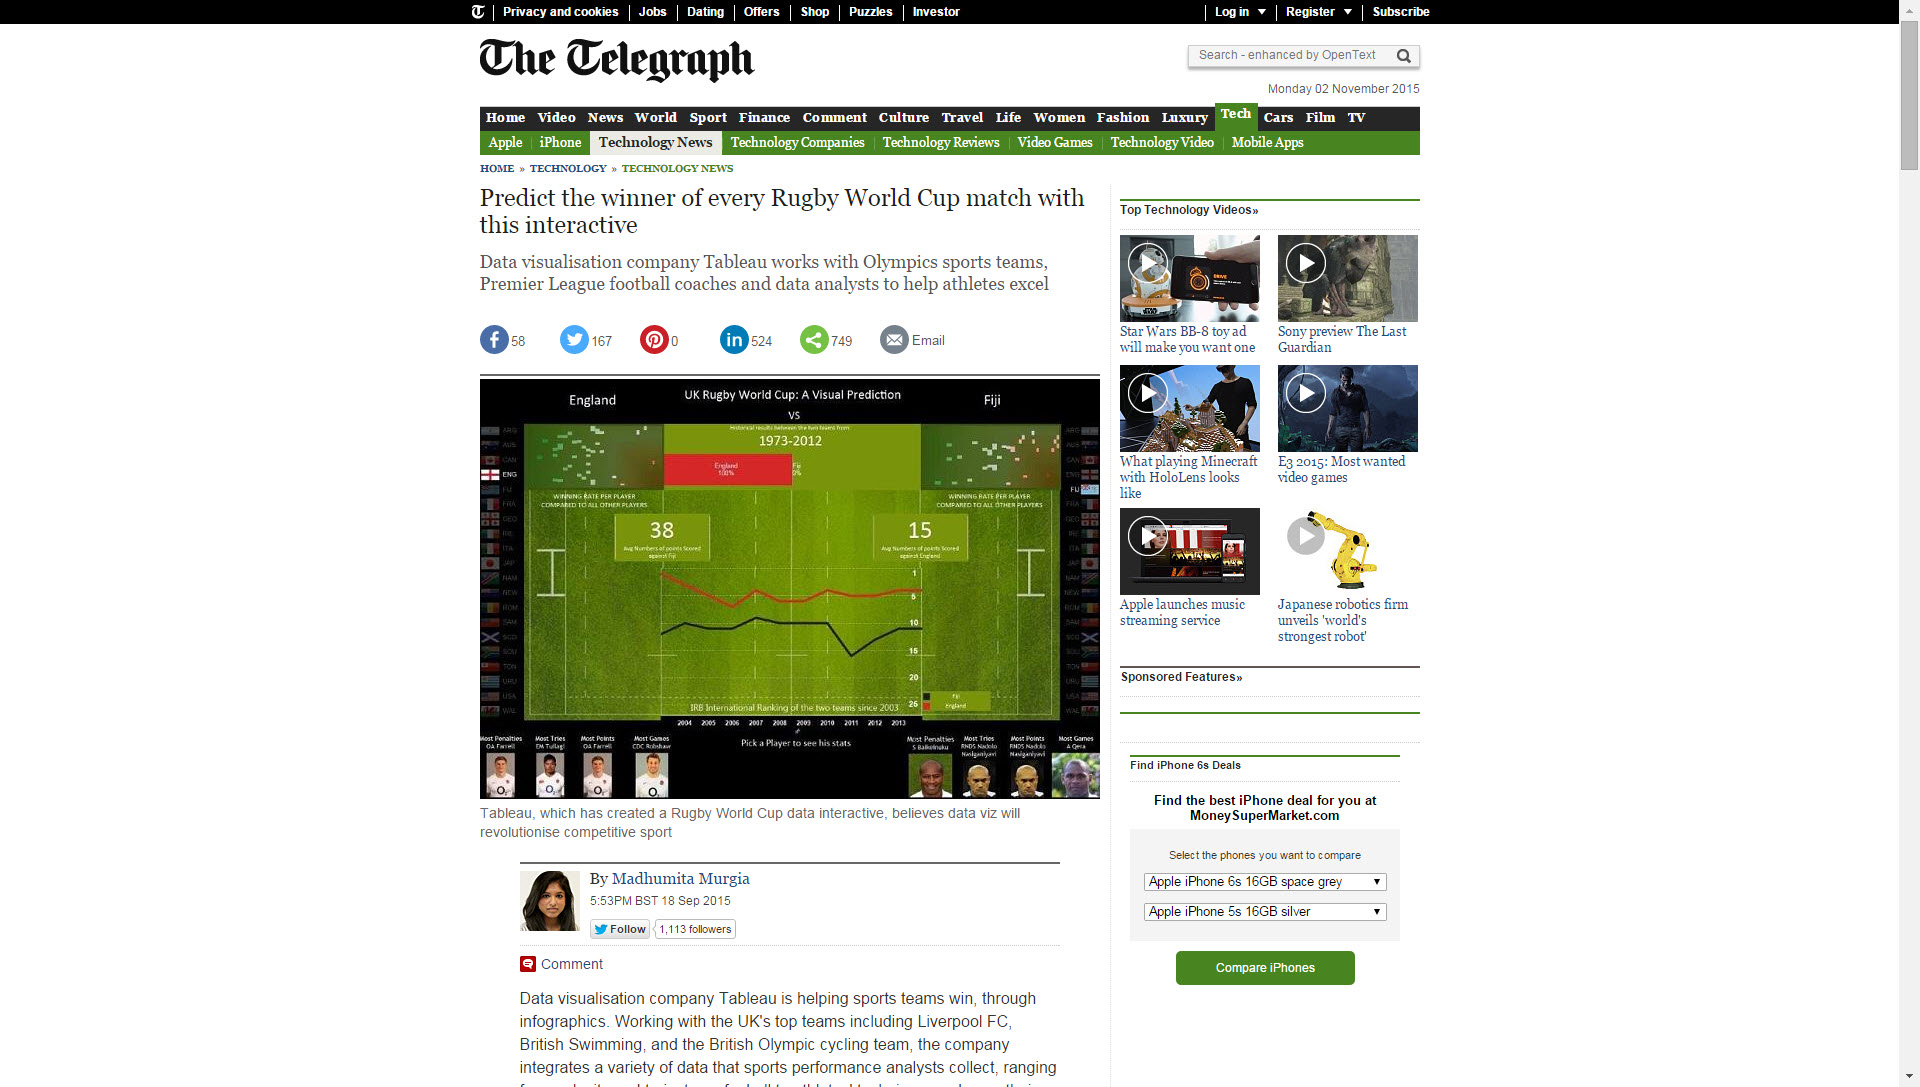
Rugby WorldCup 2015
Compare all teams before the beginning of the Rugby WorldCup 2015. Published in the Telegraph. +10.000 views combined.
Go to the Viz.