Machine Learning with Tableau - Part 1
A guide on how to use Python in Tableau.
Written by Eliana Lambrou - 04-06-2018
Most data scientists and data analysts leverage programming languages that inherit libraries with algorithms that can be used for predictions and clustering classifications. It is possible to run Python scripts and visualising its results directly in Tableau!
How is it done? The key is TabPy!
This article acts as a step-by-step guide on how to install TabPy on Windows and runs through a few examples on how to use it.
How to install TabPy
To run Python scripts in Tableau, follow the below 5 steps.
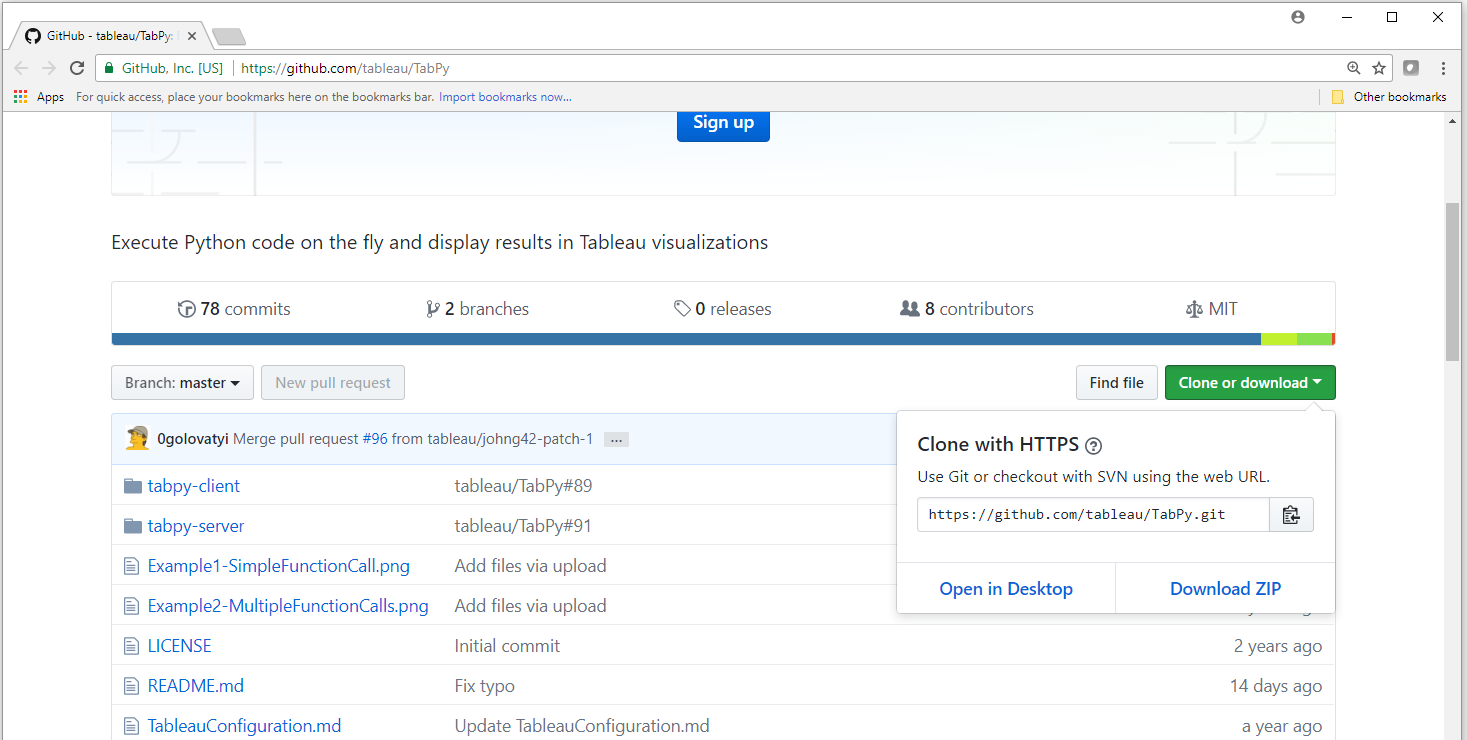
1. Go to Tableau’s GitHub page.
2. On the top right, under Clone or download, click Download ZIP. You will be directed to the folder where you want to save the TabPy-master zip file.
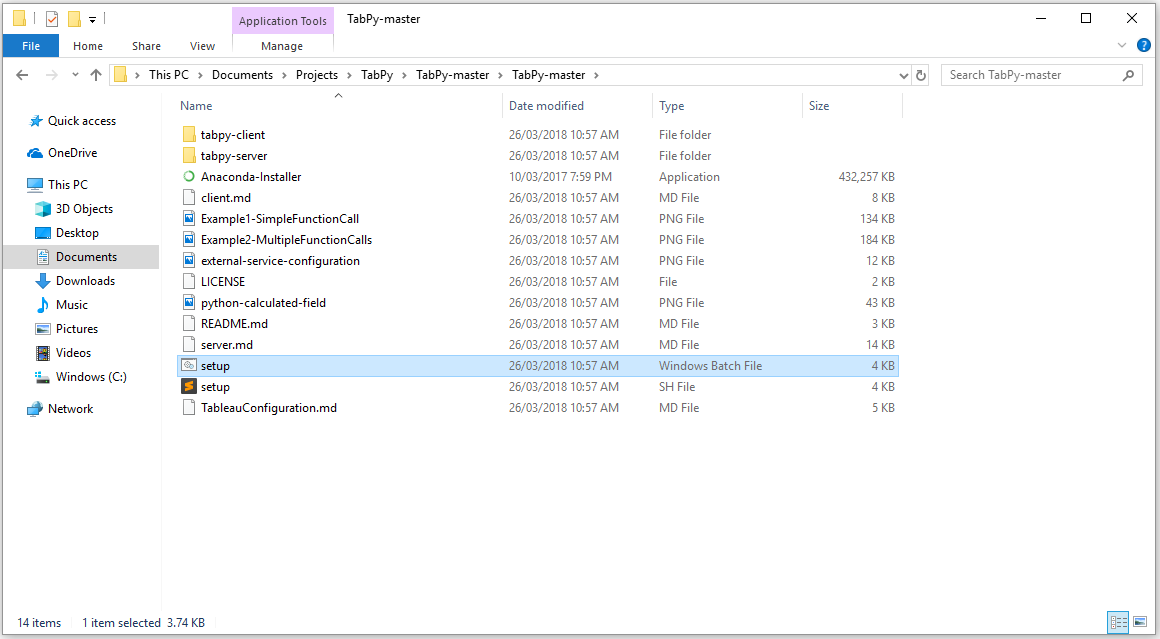
3. Go to the folder where you saved the zip file and use an unzipping tool to extract TabPy-master.
4. Execute setup.bat.
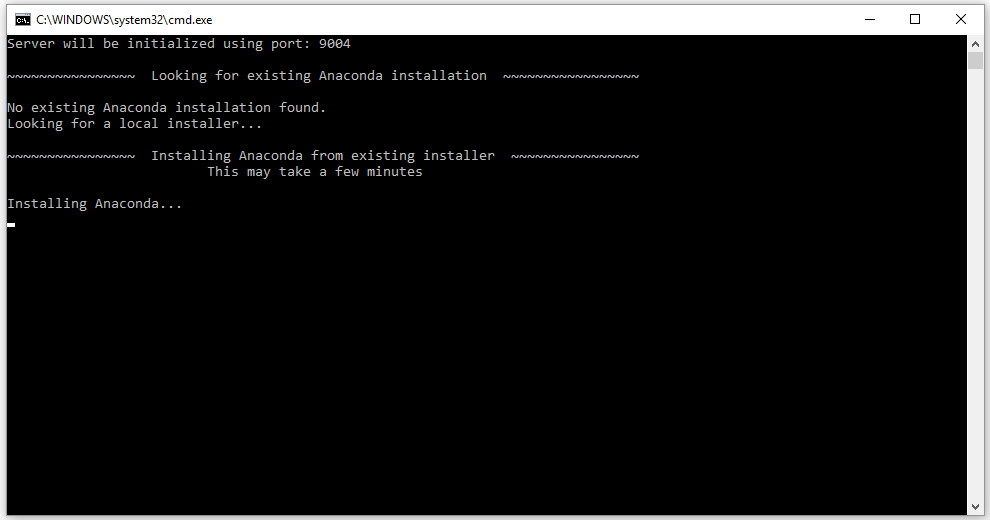
The Command Prompt will open, download, and install Anaconda environment as well as create the Tableau-Python-server environment all at once. Take note that this may take some time. Should you get an error the first time installing it, retry Step 4.
Below a screenshot of what you should be expecting to see if the file is executing correctly.
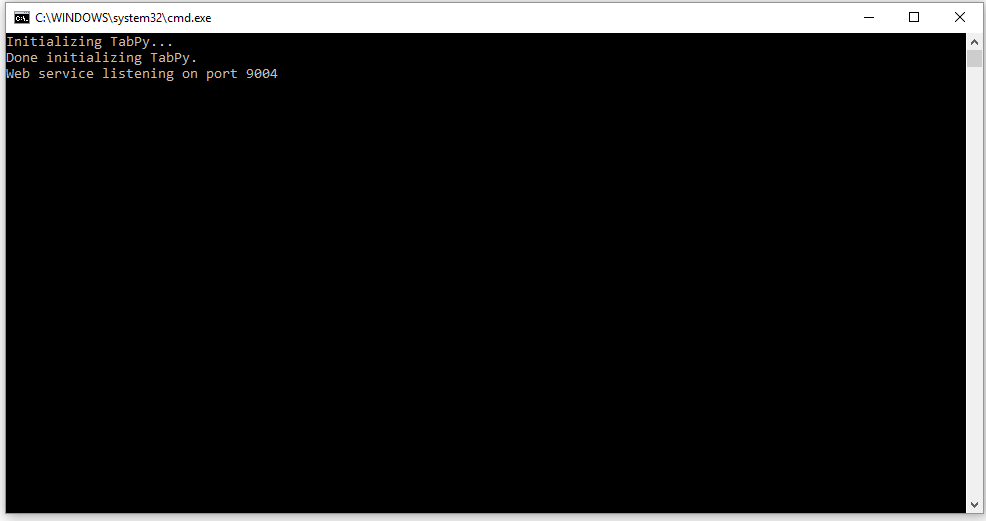
5. Once installed, you will get the following message:
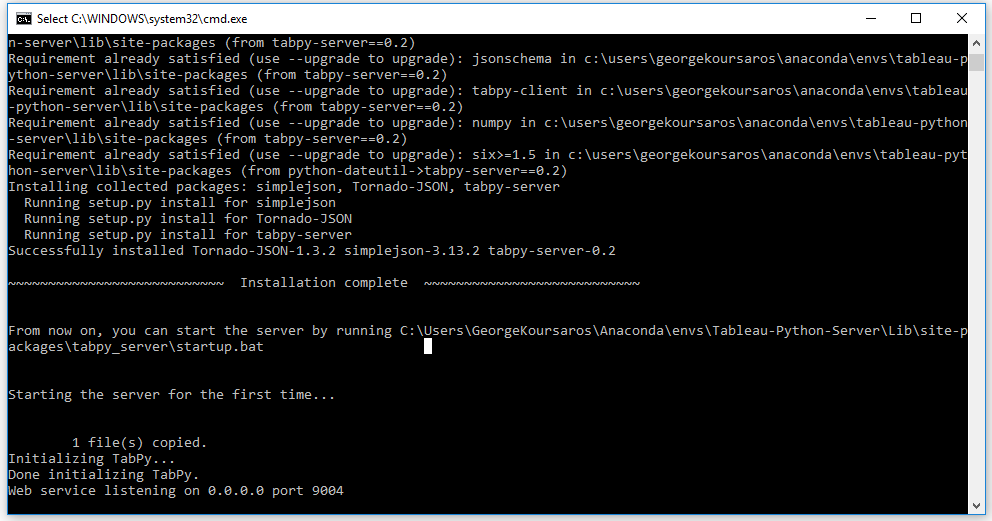
You now have TabPy running on port 9004 of your machine.
Congratulations! You have just installed TabPy and you can now start taking full advantage of Python’s advanced analytic capabilities in combination with Tableau’s amazing visualizations and features.
Tips & tricks:
• The installation may run for quite some time. If it is running for over 2 hours, we suggest to quit the command line and re-run it.
• Make sure to use the correct version of Anaconda. If Anaconda is installed twice on your machine ensure that in the later steps, you go to the Anaconda folder that has Tableau-Python-Server in it with all libraries installed. If you still face difficulties, it is better to uninstall and clean all relevant files from your computer and re-run the installation part.
How to Use TabPy in Tableau
Now that TabPy is installed, let’s run our first Python script in Tableau.
There are two different methods of running Python scripts in Tableau. The first one is to write the Python script directly in a calculated field in Tableau. Let’s do a step-by-step example.
1. First, start up your TabPy server (to listen to 9004 port). Go to the folder where tabpy_server is installed (usually C:UsersAnacondaenvsTableau-Python-ServerLibsite-packagestabpy_server) and run startup (Windows Batch file). The Command Prompt will open automatically.
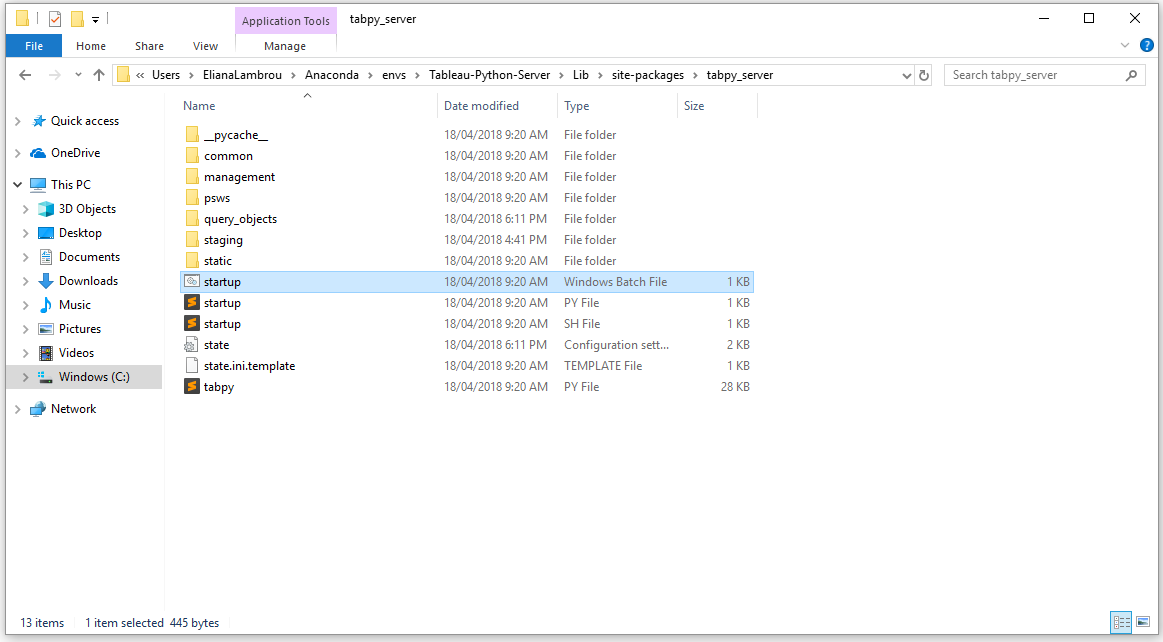
Alternatively, open the Command Prompt window, navigate to the folder specified above and type startup.bat to initialize TabPy. You should see the following message when it is initialized. Either way, you'll need a few seconds until you see the following message on the Command Prompt, which means that TabPy is initialized!
2. For this example, let's use the Sample Superstore dataset. You can download it from here. Let’s connect to the Orders table in Tableau Desktop.
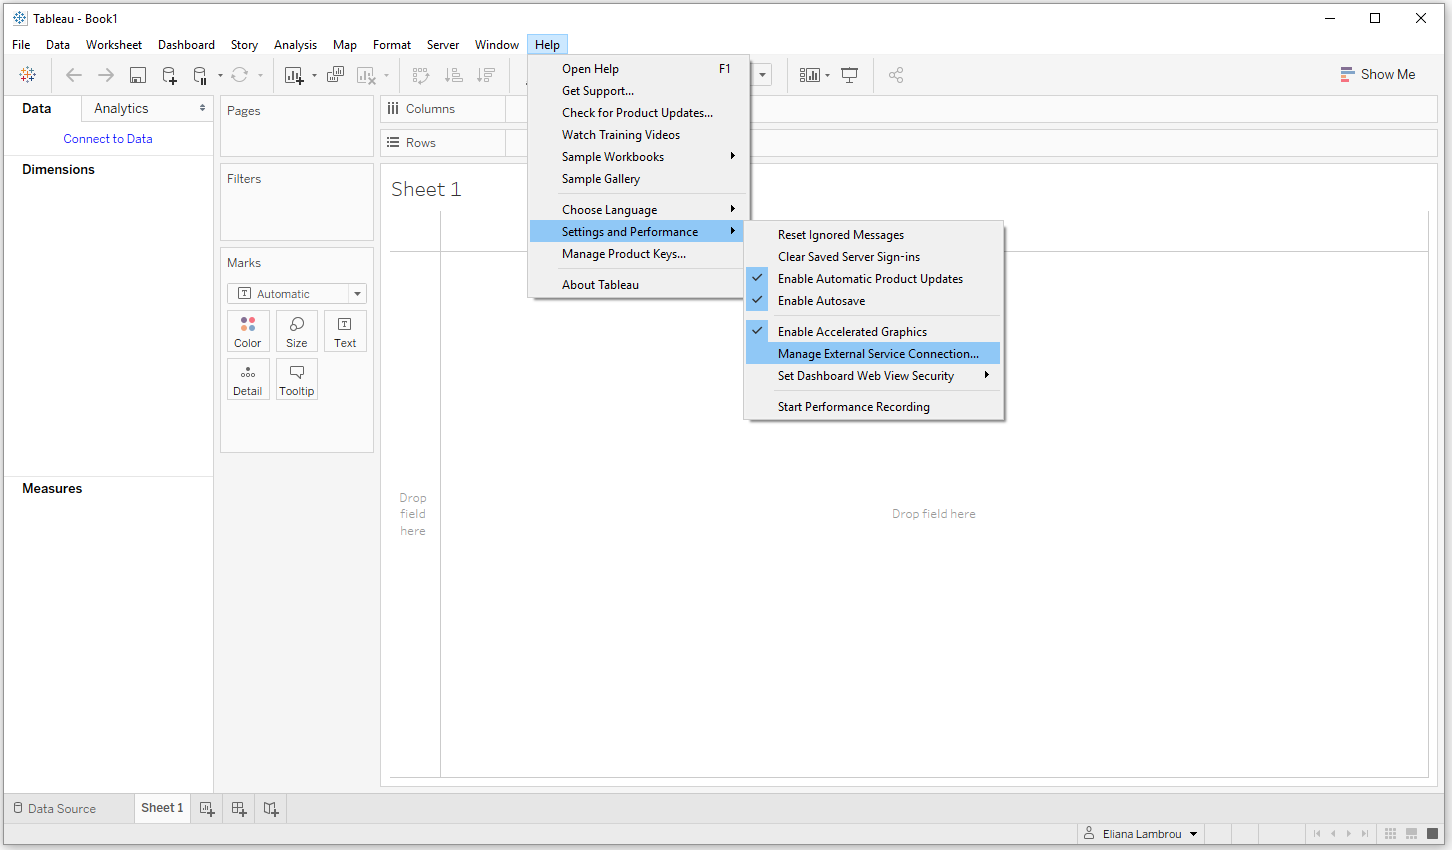
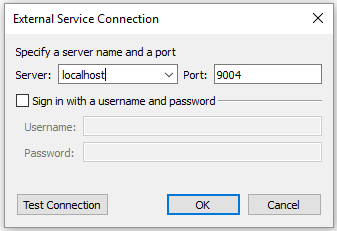
3. Now, we can connect to TabPy server from Tableau: Open Tableau, click on Help from the menu bar, click Settings and Performance and then click Manage External Service Connection. You should have Server set to localhost and Port to 9004. Click OK and you are ready to use TabPy.
4. Now, let’s create a calculated field called TabPy Example1. This will be a straightforward example allowing you to run a Python script in Tableau using a calculated field. Let’s say we want to find the profit ratio using a Python script. The script reads as follows:
SCRIPT_REAL("
ratio = [ ]
for i in range(0,len(_arg1)):
ratio.append(_arg2[i]/_arg1[i])
return ratio
", SUM([Sales]), SUM([Profit]))
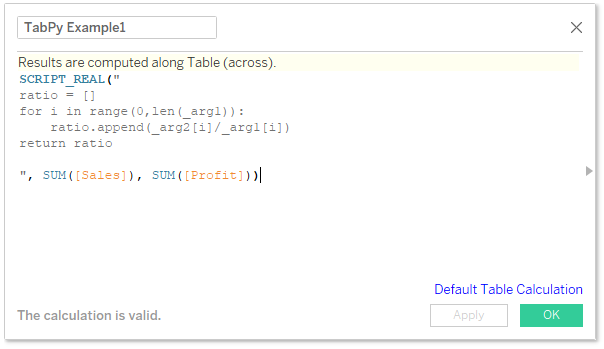
Let’s explain the above calculated field.
• First, we write SCRIPT_REAL meaning that the returned values will be real values. But, why do we need this? Every calculated field that you write in Tableau returns a different type of variable. This can fall under one of the following categories: Number, Boolean, String, Date. In contrast with Tableau, the standard programming languages usually return the following types of variables: Boolean, Integer, Float (or Real) and String. As Tableau needs to know what the type of its calculated field is, we need to specify it so Tableau understands what the Python script returns. You can use the following types in front of the function that you return: SCRIPT_BOOL , SCRIPT_INT , SCRIPT_REAL , SCRIPT_STR.
• Then we write the Python code in quotation marks and wherever we need to input an argument (i.e. a field from Tableau) we write it as _arg1, _arg2 etc. So, in this case we want to go through all rows in Sales and Profit, get the ratio of the two and return a list with all the values. This can also be done in Tableau with SUM([Profit])/SUM([Sales]), but this is to get an idea of how to run Python code and check with the already calculated profit ratio in Tableau.
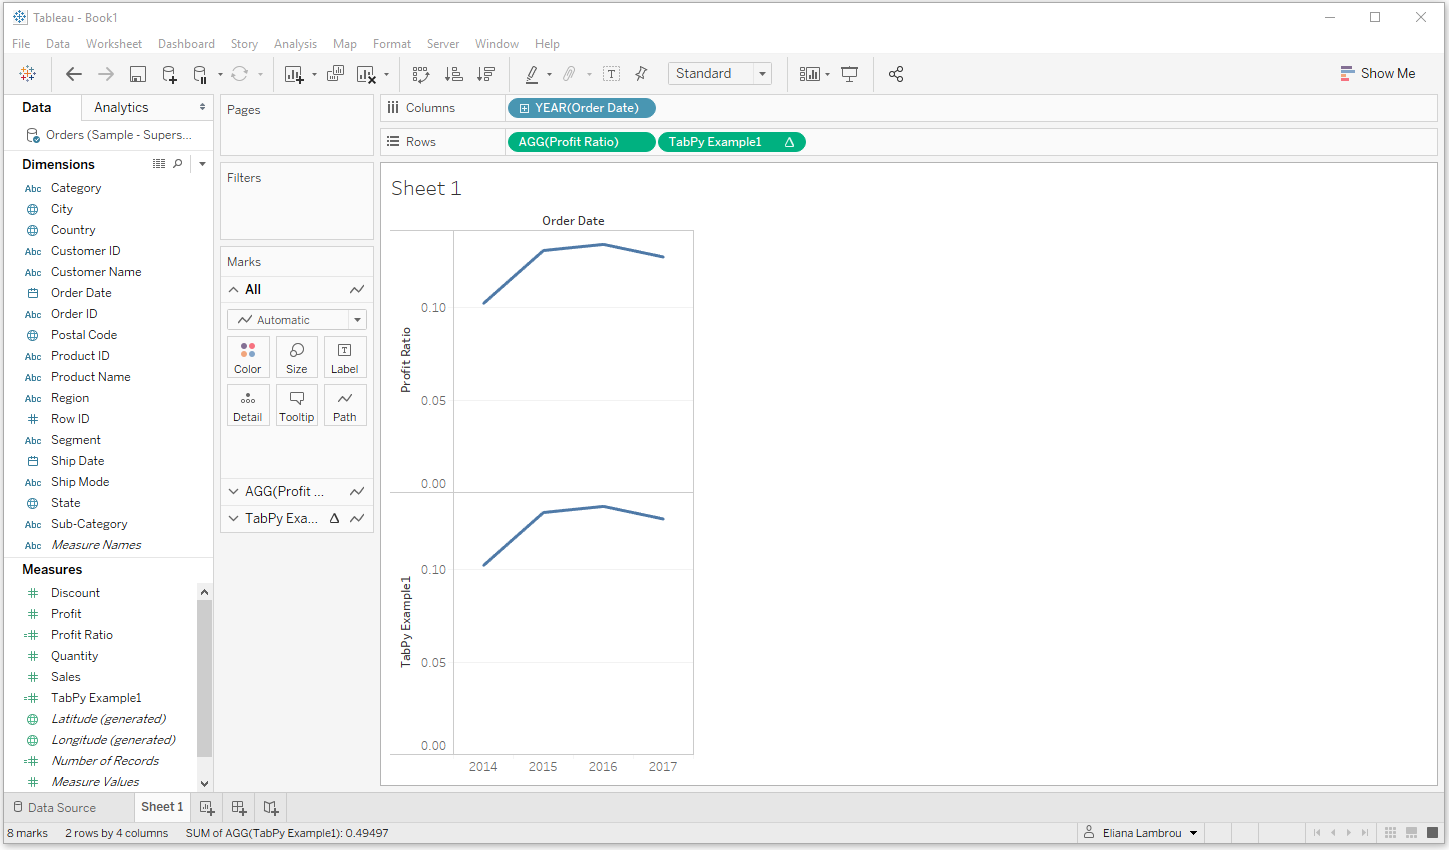
To double-check we are getting the same results:
• Create another calculated field called Profit Ratio using SUM([Profit])/SUM([Sales]).
• Drag Profit Ratio on the Rows shelf and Order Date on the Columns shelf (you should see the standard Profit Ratio timeline).
• Now drag TabPy Example1 to the rows shelf next to Profit Ratio.
If the Python script runs correctly, the two plots should be identical to the below.
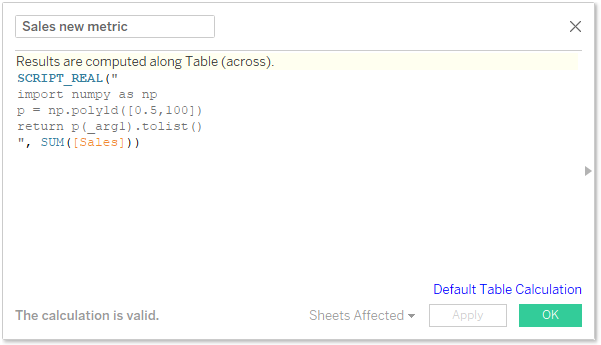
Similarly, try to run your own Python scripts. For example, let's assume that your Sales Manager told you that there is a new metric that he/she would like. It follows a polynomial of degree 1 with coefficients (0.5,100). To calculate this new metric you may use a Python script in Tableau that reads as follows:
SCRIPT_REAL("
import numpy as np
p = np.poly1d([0.5,100])
return p(_arg1).tolist()
", SUM([Sales]))
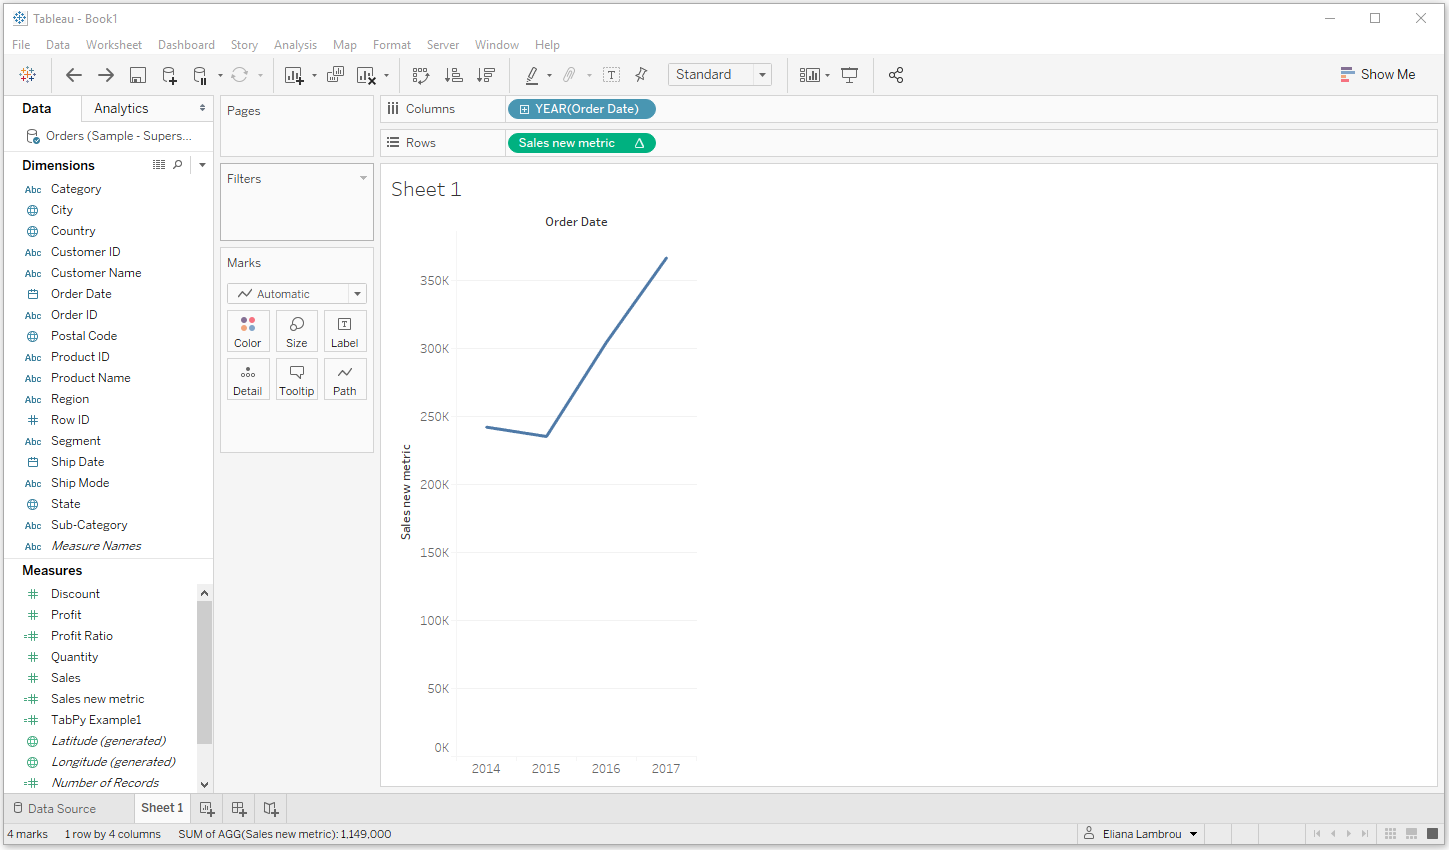
Dragging it on the view you should see something like the image below.
Final Thoughts
You may have realised that all the above calculations could have been done in Tableau without using Python. So, why should we go through the process of downloading and configuring Python server in Tableau and write Python scripts? This question is answered by another question: Why is Python so popular amongst Data Scientists? I, as a data lover, would reply “because of its power to easily forecast, utilising widely-used libraries that contain well-known algorithms”. And indeed, imagine how nice it would be to make predictions for your business in Tableau, by calling a simple Python script and then being able to incorporate it into Tableau’s visualisations.
If you are interested, stay tuned for the upcoming article, where we will use TabPy to predict if a new potential client in a bank is likely to repay his/her loan using Machine Learning. And all this, by running a Python script in Tableau!