REGIONAL SALES
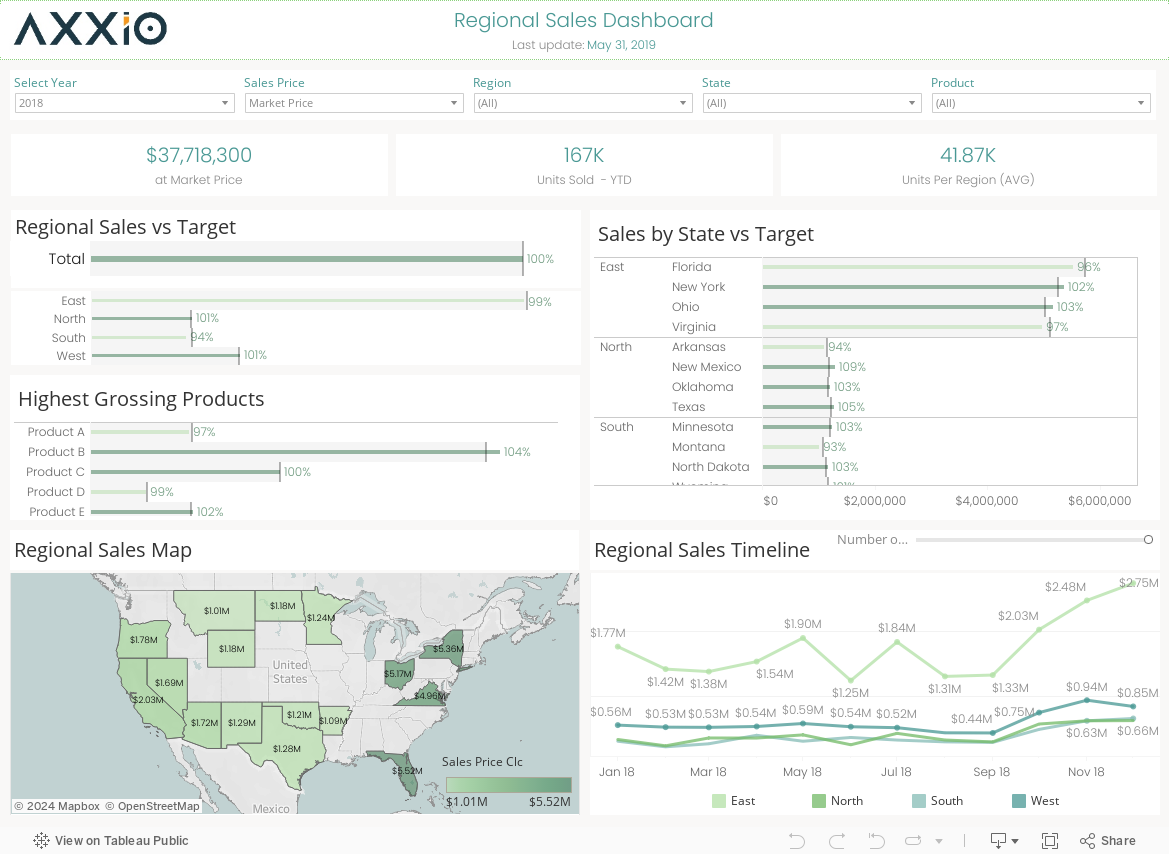
This dashboard allows you to examine your company’s regional sales at the highest level of regions, down to the level of state / highest grossing product. Review your company’s performance using historical data over the timeline and use the filters at the top part of the dashboard to extract a specialized performance report within a few seconds. To utilize Tableau’s power, make sure to click on our graphs and watch how the rest of the dashboard changes to fit your selected criteria. Try selecting one or multiple states from the “Regional Sales Map” or use the parameter “Number of Regions” to filter down to the highest performers in terms of sales. Drill down to whatever level of detail you’re interested in and press the “Download” button to extract images, PDFs or create your PowerPoint presentation!