Want to run Python in Tableau? Meet TabPy!
Part I: A quick guide on how to install TabPy and how to run simple Python scripts
Written by Eliana Lambrou - 11-06-2018
Data scientists and data analysts love programming languages that inherit libraries with algorithms that can be used for predictions and clustering classifications. In this niche, Python and R are the most well-known languages among data lovers. Although forecasting is nice and very powerful, you also need to find a way to visualize it, and integrate it in an interactive dashboard, so relevant people from the company can understand it, use it and consequently the business can derive value from it
Tableau now offers the possibility of running Python scripts, and then allowing you to show the results using its fabulous visualizations and powerful features! But...how do we use Python in Tableau? The answer lies in one word: TabPy! Here, we offer a step-by-step guide on how to install TabPy, and some examples of how to use it! If you are as enthusiastic as I am about being able to inherit Python in Tableau then please join me in this exciting journey through the fascinating world of TabPy!
How to install TabPy on a Windows machine
In order to be able to run Python scripts in Tableau, you should download TabPy from Tableau’s github and configure it so that a local Python server is installed on your machine. It is much simpler than it sounds, so follow these steps, and you will have TabPy on your computer in no time!
1. Go to the Tableau’s github website.
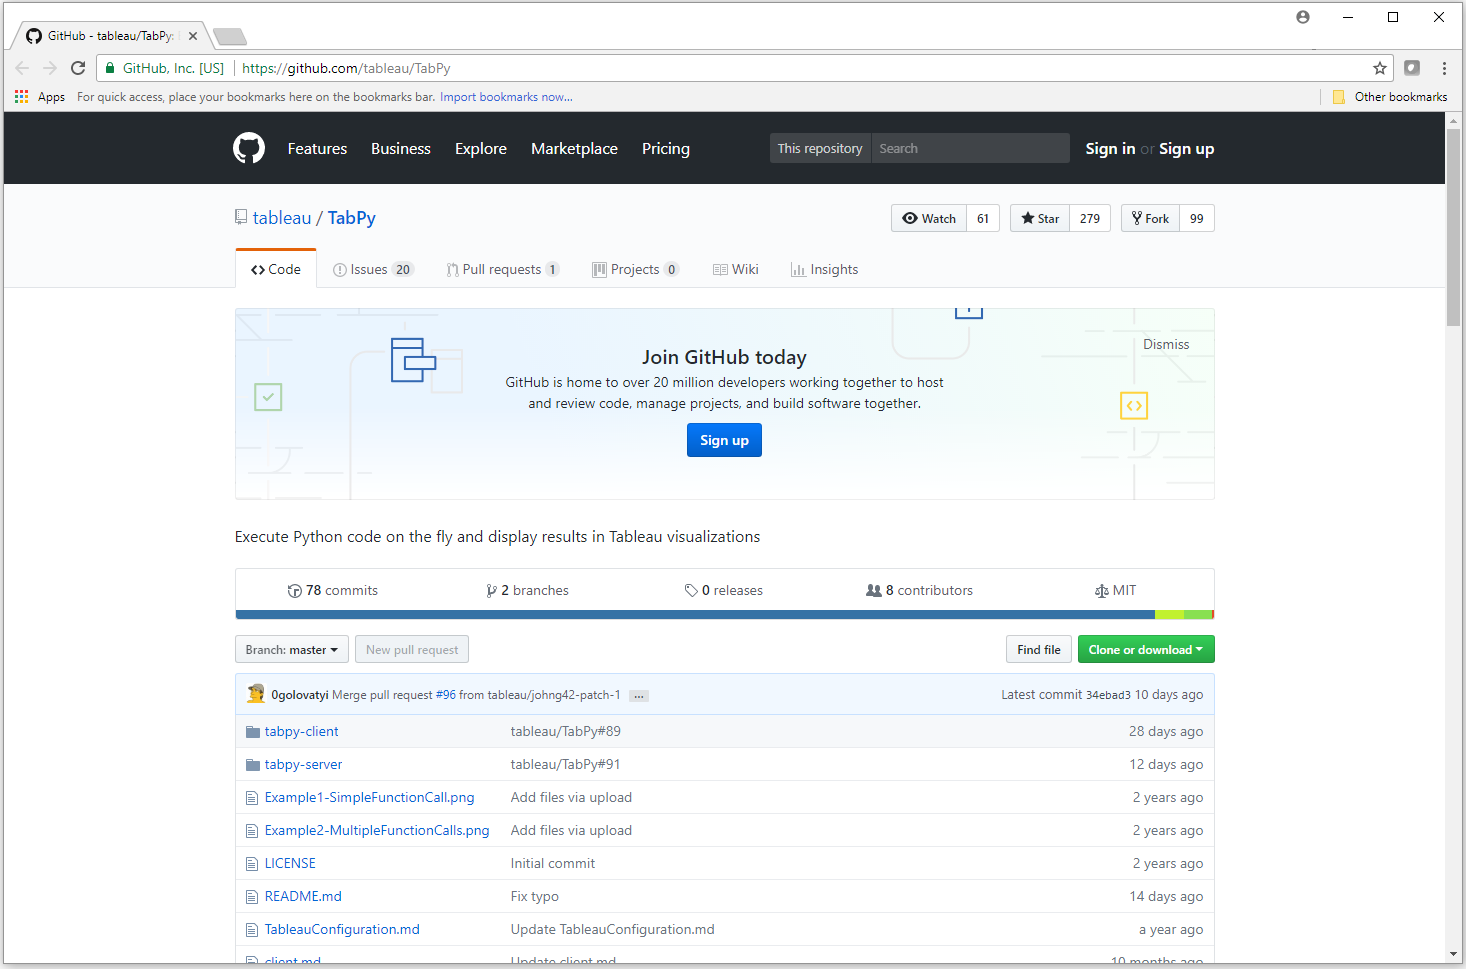
2. On the upper right part (under the title), there is a green button “clone or download”. Click on the arrow and select Download ZIP. You will be directed to the folder where you want to save the TabPy-master zip file.

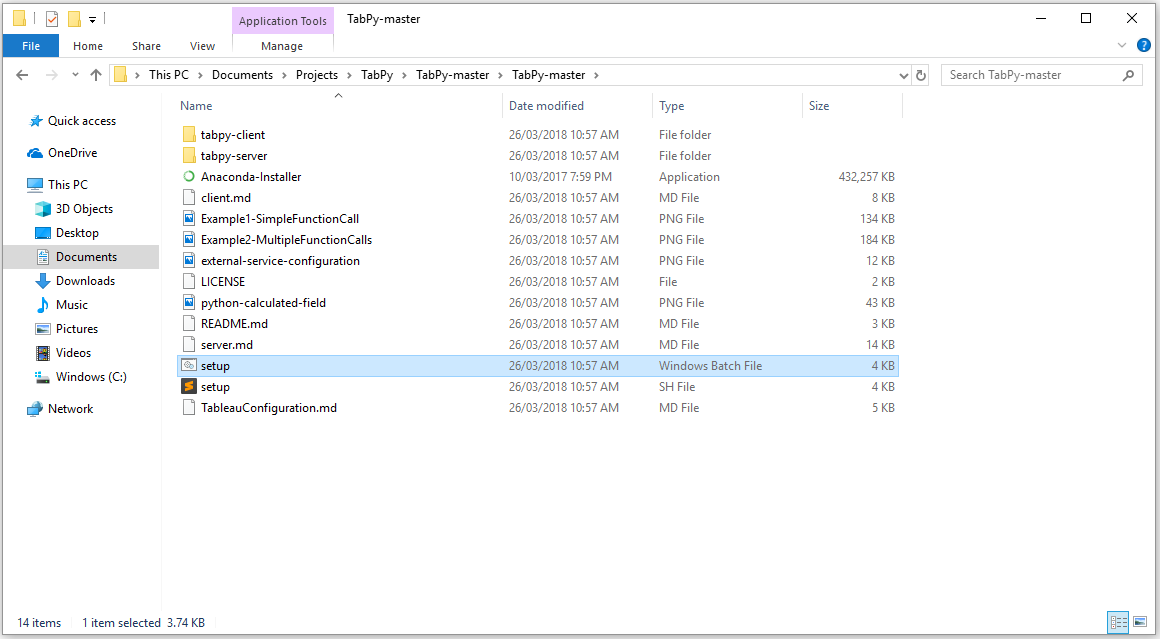
3. Go to the folder where you saved the zip file and use an unzipping tool (e.g. WinZip) to extract TabPy-master.
4. Execute setup.bat by double-clicking on it.
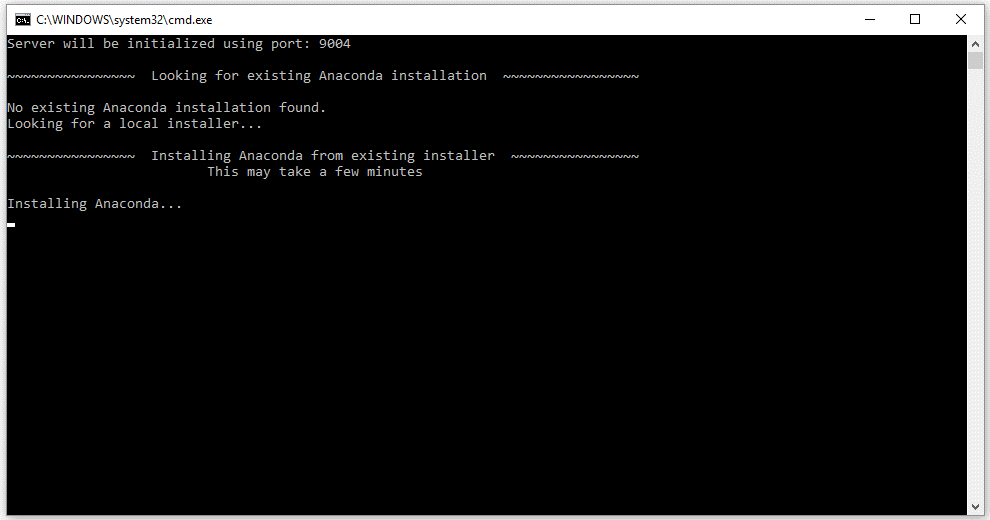
The Command Prompt will open and it will download and install the Anaconda environment, and create the Tableau-Python-server environment all at once. Bear in mind that this might take some time. If you get an error the first time that you are installing it, try re-executing setup.bat...and be patient with this step, as it might take a bit of time. Just bear in mind that after this is complete you will be able to run your own Python scripts in Tableau
5. When it is installed you will get the following message.
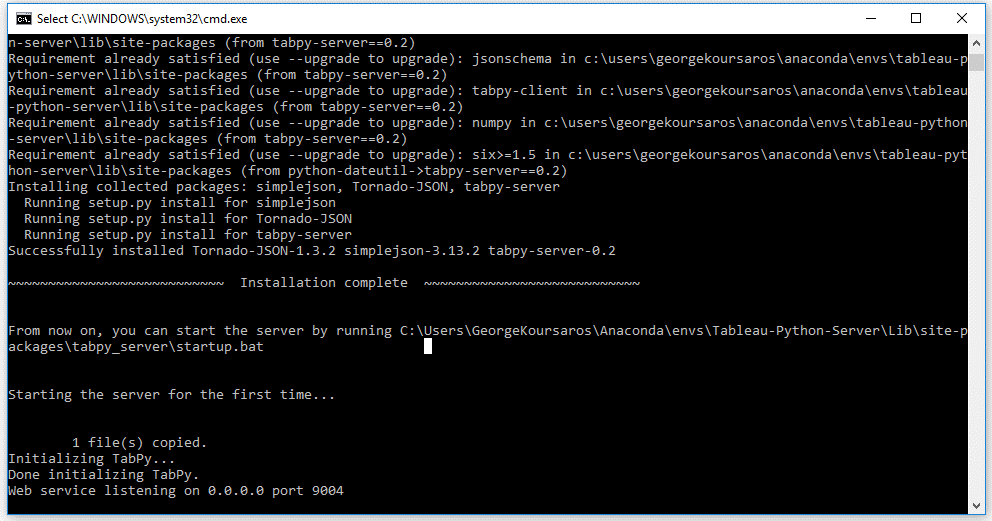
...and you have TabPy ready to run on port 9004 of your machine!
Congratulations! You have just installed TabPy on your machine! Now you can start taking full advantage of Python’s advanced analytic capabilities, in combination with Tableau’s amazing visualizations and features.
Extra tips / Troubleshooting
i) Sometimes the installation runs forever. If it runs over two hours, it is better to quit the command line and re-run it. The second installation should be much faster and more successful.
ii) Make sure that you use the correct Anaconda. If Anaconda is installed twice on your machine, make sure that in the later steps that you go to the Anaconda folder that has Tableau-Python-Server in it, with all libraries installed. If you still have problems then it is better to uninstall and clean all relevant files from your computer, and re-run the installation part.
How to Use TabPy in Tableau
Now that TabPy is installed, let’s run our first Python script in tableau.
There are two different methods of running Python scripts in Tableau. The first one is to write the Python script directly in a calculated field in Tableau. Let’s go through an example step-by-step to give you a better understanding of what is meant by this.
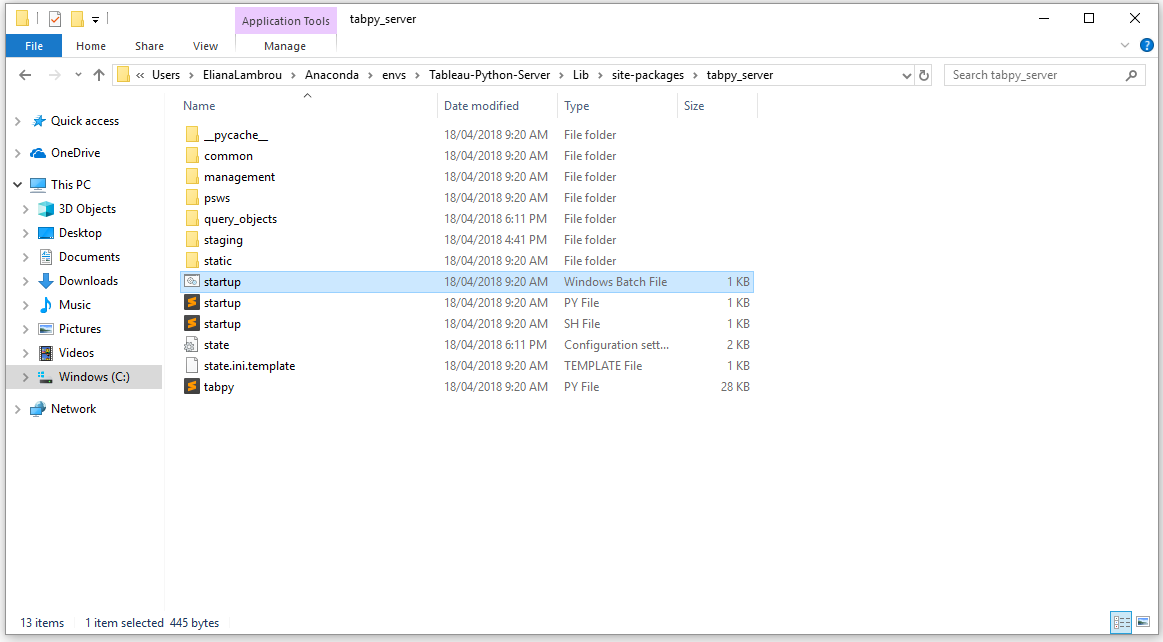
1. First, you need to startup your TabPy server (to listen to 9004 port). To do this go to the folder where tabpy_server is installed (usually C:\Users\<Username>\Anaconda\envs\Tableau-Python-Server\Lib\site-packages\tabpy_server) and run startup (windows batch file). The command prompt will open automatically.
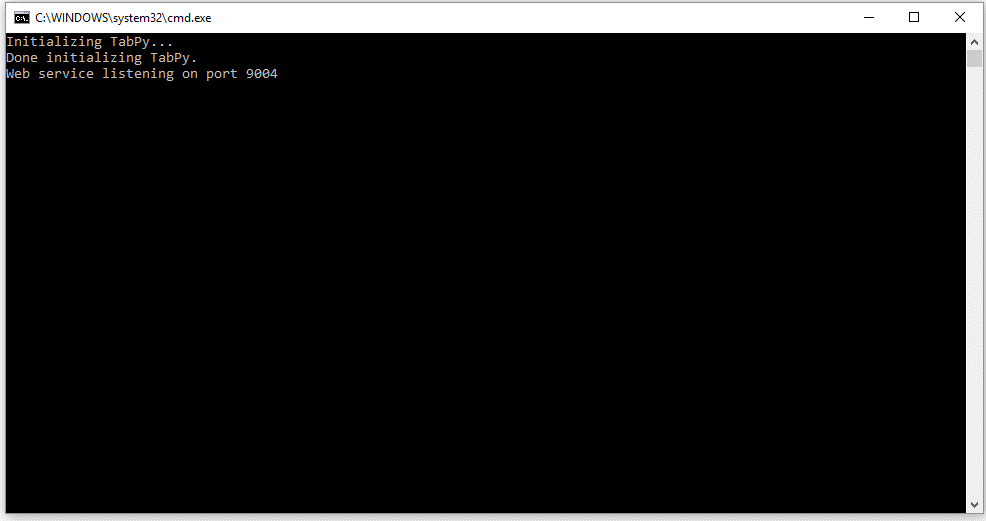
Alternatively, you can open up the Command Prompt window, navigate to the folder specified above, and type startup.bat to initialize TabPy. You should see the following message when it is initialized. Either way, you will need to wait a few seconds until you see the following message on the Command Prompt which means that TabPy is initialized!
2. For the purposes of this part of the article we will use the Sample – Superstore dataset. If you don’t have this dataset then you can download it from here. But, first, let’s connect to it, via the usual procedure (we will use only Orders sheet).
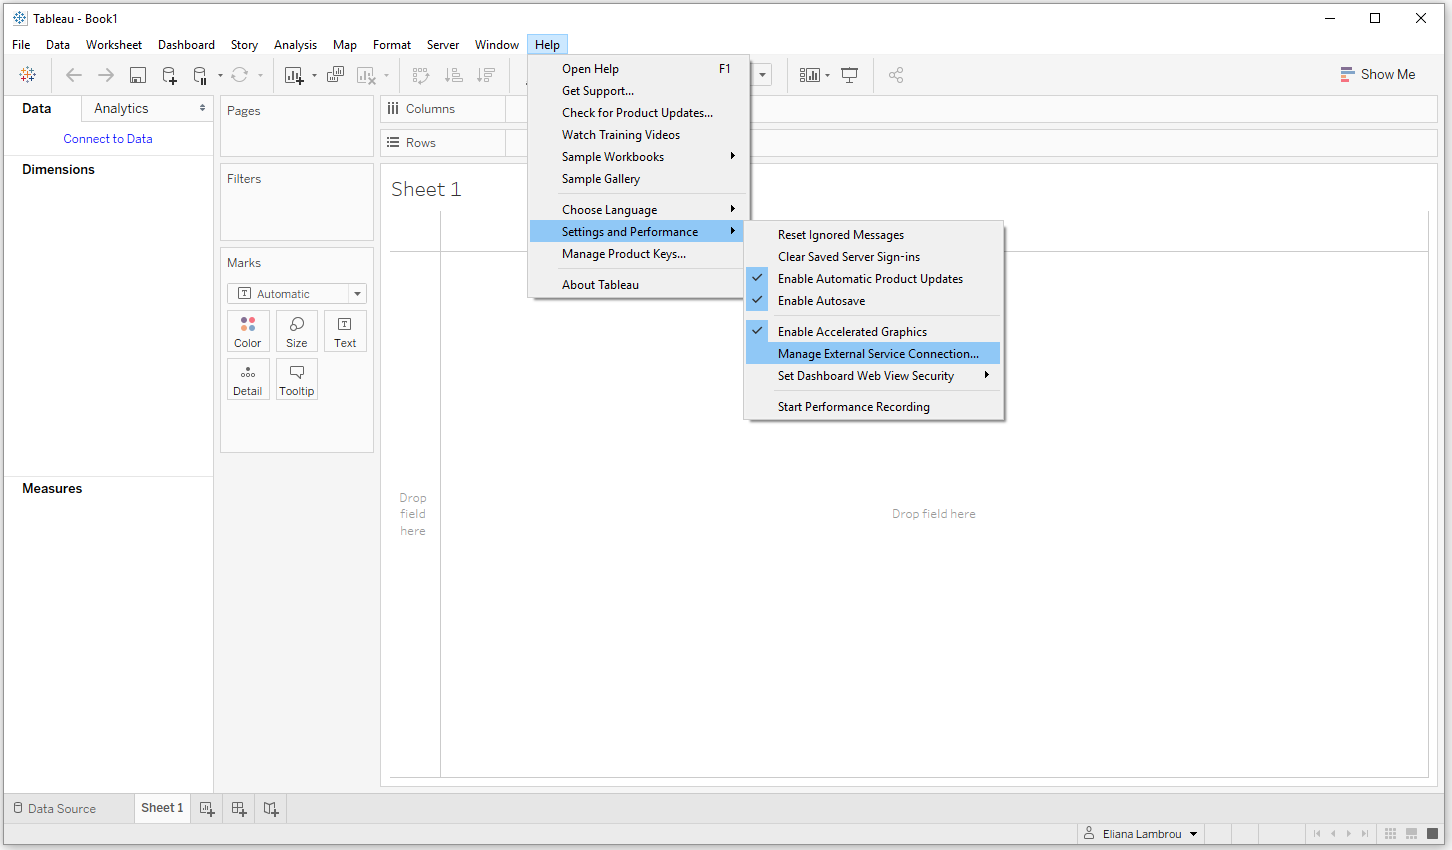
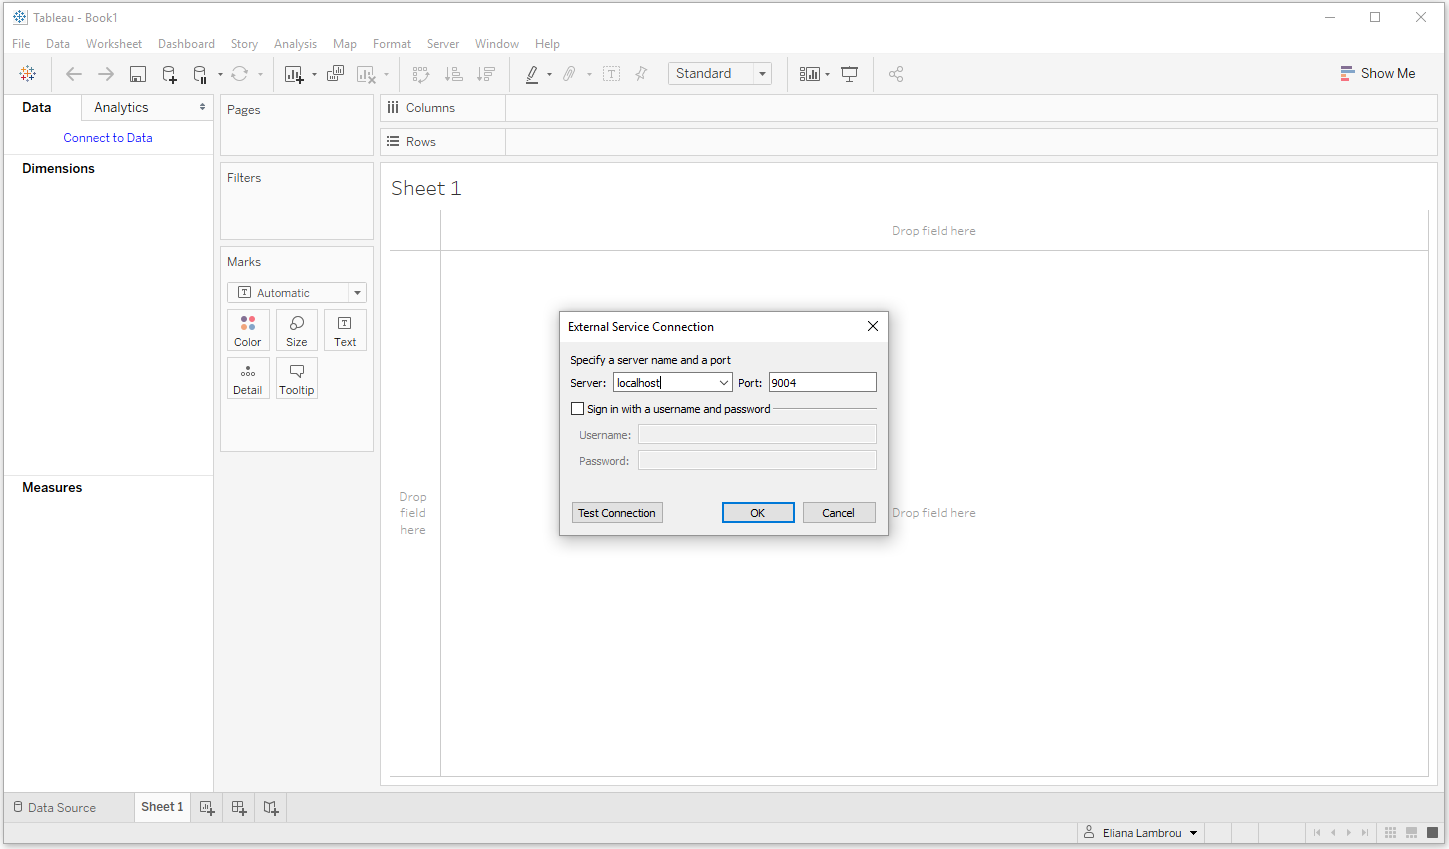
3. Now we can connect to TabPy server from Tableau: Open Tableau. Click on Help from the menu bar, click Settings and Performance, and then click Manage External Service Connection. You should have Server set to localhost and Port to 9004. Click OK and you are ready to use TabPy.
4. Then let’s create a calculated field called TabPy Example1. This will be a very simple example just to show how to run a Python script in Tableau from a calculated field. Let’s say we want to find the Profit Ratio from a Python script. The script reads as following:
SCRIPT_REAL("
ratio = []
for i in range(0,len(_arg1)):
ratio.append(_arg2[i]/_arg1[i])
return ratio
", SUM([Sales]), SUM([Profit]))
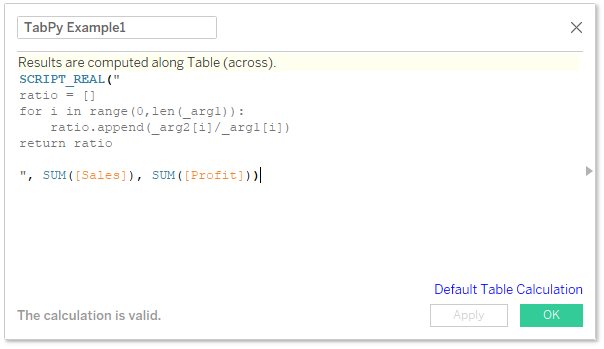
Let’s explain the above calculated field.
i) First, we write SCRIPT_REAL meaning that the returned values will be real values. But why do we need this? Every calculated field that you write in Tableau returns a different type of variable. This can fall within one of the following categories: Number, Boolean, String, Date. In contrast with Tableau, the standard Programming Languages usually return the following types of variables: Boolean, Integer, Float (or Real) and String. As Tableau needs to know what the type of its calculated field is, we need to specify it so that Tableau understands what the Python script returns. You can use the following types in front of the function that you return: SCRIPT_BOOL , SCRIPT_INT , SCRIPT_REAL , SCRIPT_STR
ii) Then we write the Python code in quotation “ ” and wherever we need to input an argument (i.e. a field from Tableau) we write it as _arg1, _arg2 etc. So in this case we want to go through all rows in Sales and Profit, get the ratio of the two, and return a list with all of the values. Of course, this can be done in Tableau with a simple SUM([Profit])/SUM([Sales]), but this is just to get the idea of how to run a Python code and check with the already calculated Profit Ratio in Tableau.
To check it:
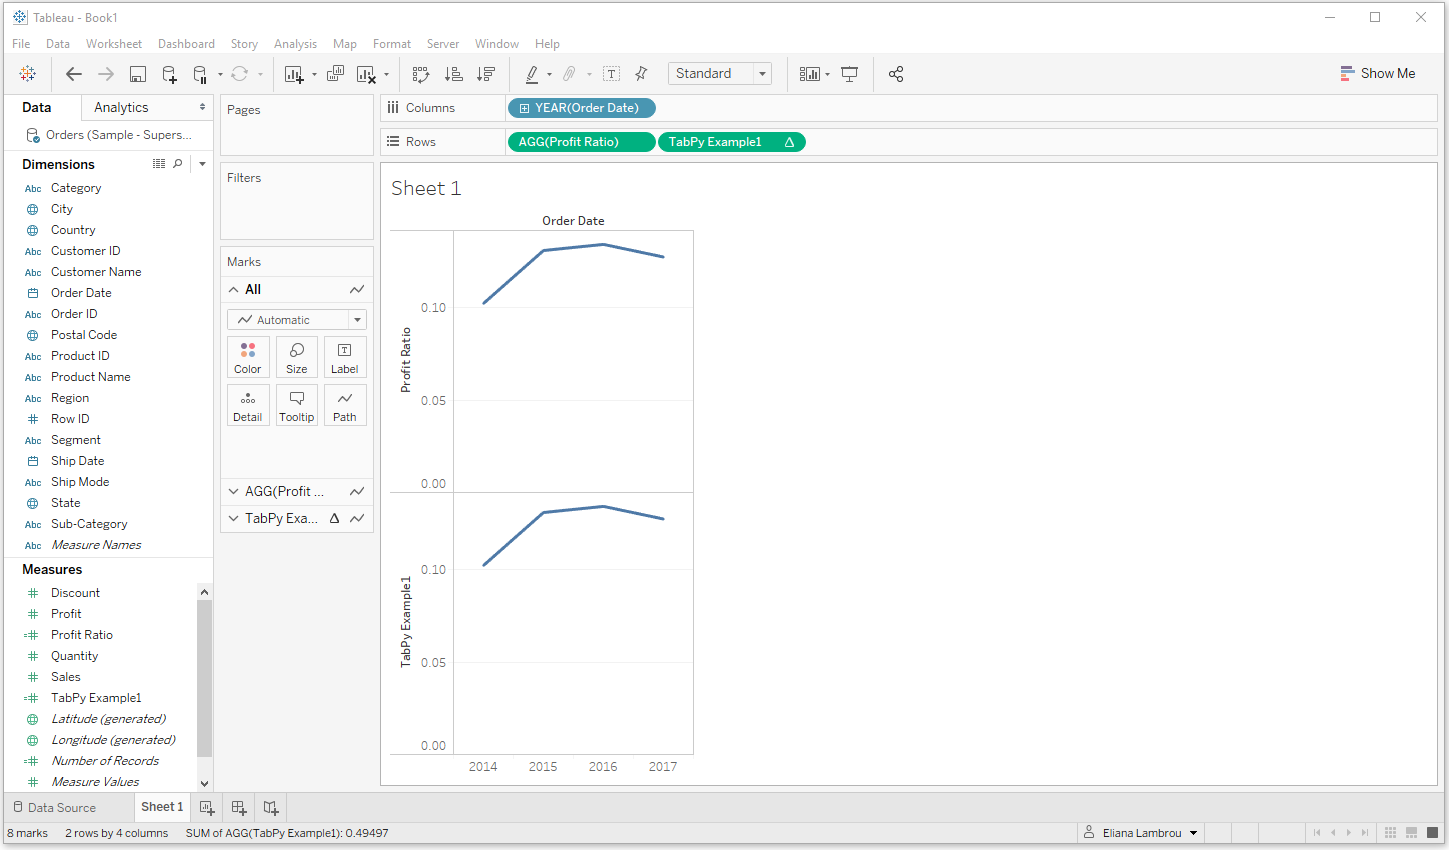
i) Create another calculated field called Profit Ratio using SUM([Profit])/SUM([Sales])
ii) Drag Profit Ratio on the Rows shelf and Order Date on the Columns shelf (you should see the standard Profit Ratio timeline)
iii) Now drag TabPy Example1 to the rows shelf next to Profit Ratio
If the Python script runs correctly, the two plots should be identical as below
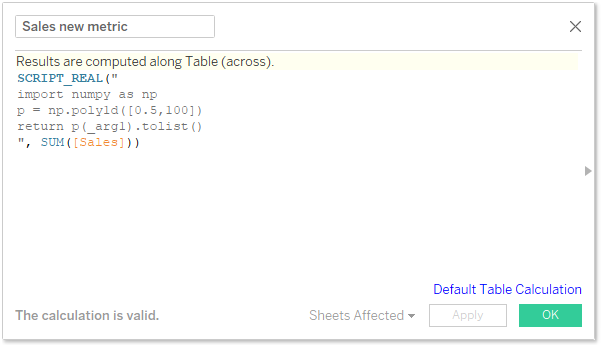
Similarly, try to run your own Python scripts. For example, suppose that your Sales Manager told you that there is a new Sales-metric that (s)he wants, which follows a polynomial of degree 1 with coefficients (0.5,100). To calculate this new Sales-metric you could have a Python script in Tableau that reads as following:
SCRIPT_REAL("
import numpy as np
p = np.poly1d([0.5,100])
return p(_arg1).tolist()
", SUM([Sales]))

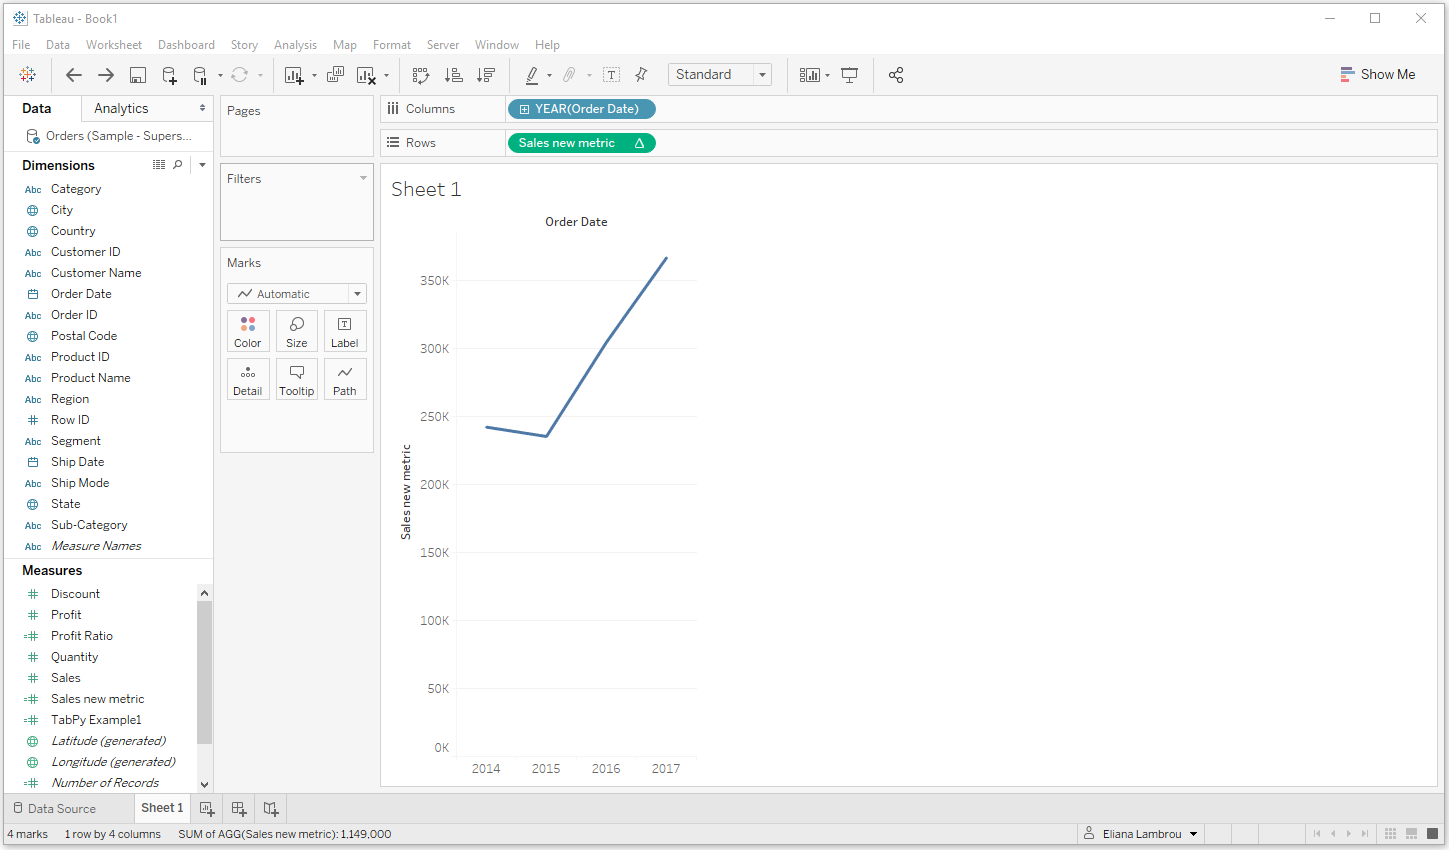
Dragging it on the view you should see something like the image below.
Final Remark
You might think that all these are nice, but actually they are calculations that could have be done in Tableau without using Python? So...why should we go through the hassle to download and configure Python server in Tableau, and write Python scripts?
The answer to the above question is answered by another question: Why is Python so popular amongst Data Scientists? As a data lover, I would reply “because of its power to easily forecast, using widely used libraries that contain well-known AI algorithms”.
And indeed, imagine how nice it is to be able to make predictions for your business in Tableau, by calling up a simple Python script, and then being able to integrate it into Tableau’s visualizations. But this is another big subject...if you are interested in it, stay tuned for an upcoming article, in which we will use TabPy to predict if a new potential client in a bank is likely to repay his/her loan using Machine Learning...
And all this, while running a Python script in Tableau! Watch this space! It is coming, and it will blow your mind!!