The Power of Dashboard Extensions
Written by Omiros Antoniou - 21-02-2019
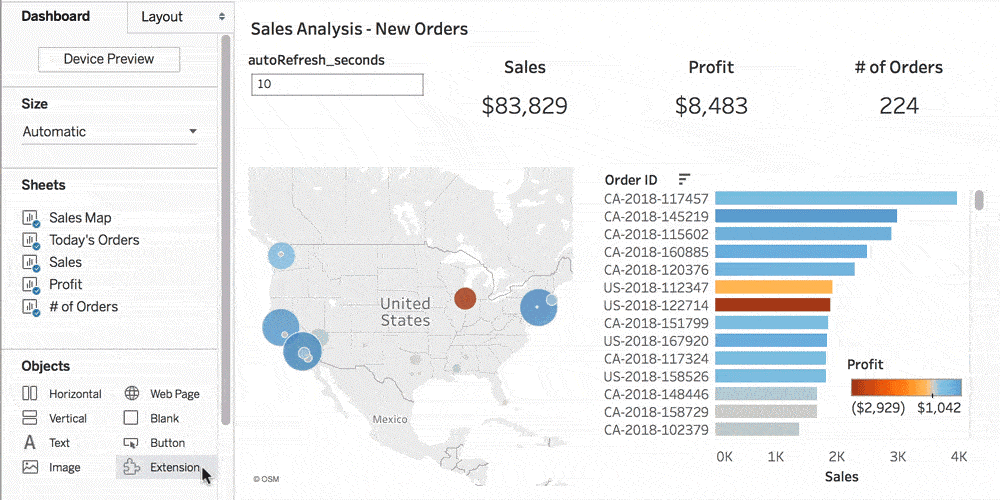
When Tableau released version 2018.2, the software introduced the capability of using extensions, which revolutionizes how users create dashboards. Extensions provides users with the option to directly implement third party functionality in dashboards, with the impressive tools that are already available on Tableau’s dedicated Extensions gallery. Although this might seem like just another one of Tableau’s features in its increasingly expansive toolkit, extensions can have a significant impact on your future visualizations
Through the extension API, Tableau users can simply drag and drop plug-ins from third-party developers, and if possible, integrate their own applications within their Tableau dashboards, in order to build custom visualizations, improve predictive analytics, and even write back to a database. This exciting new feature has been a prominent topic in discussions within the Tableau community due to the incredible advantages and future prospects of its implementation.
Through its third-party integration, extensions can significantly enhance the functionality of your dashboards, as well as filling potential gaps within Tableau’s existing features. An extension could, for example, provide you with a feature that you’ve been dying for Tableau to release, and can also make your life easier through a simple drag-and-drop.
Extensions can also motivate developers to experiment, in order to improve their dashboards, resulting in a co-creative environment with Tableau by effectively contributing to its capabilities. This can also have incredible implications for the integration of APIs related to machine learning and augmented analytics, with developers essentially being given the key to endless possibilities and innovation.
Extensions API can make Tableau easier to adopt within companies, as their existing business applications can then be integrated into dashboards. This will enable them to customize their workbooks, and improve the functionality, and potentially the interactivity, of their reports, while also then having the possibility of writing back to their company’s database. The Write-back extension can considerably improve productivity. For example, if a financial analyst evaluates the company’s performance through Tableau, the IT department could, in conjunction with this, create a custom write-back extension that will update reports without having to switch between software tools. This automation can create a personalized Tableau experience that aligns with a person’s responsibilities and daily tasks.
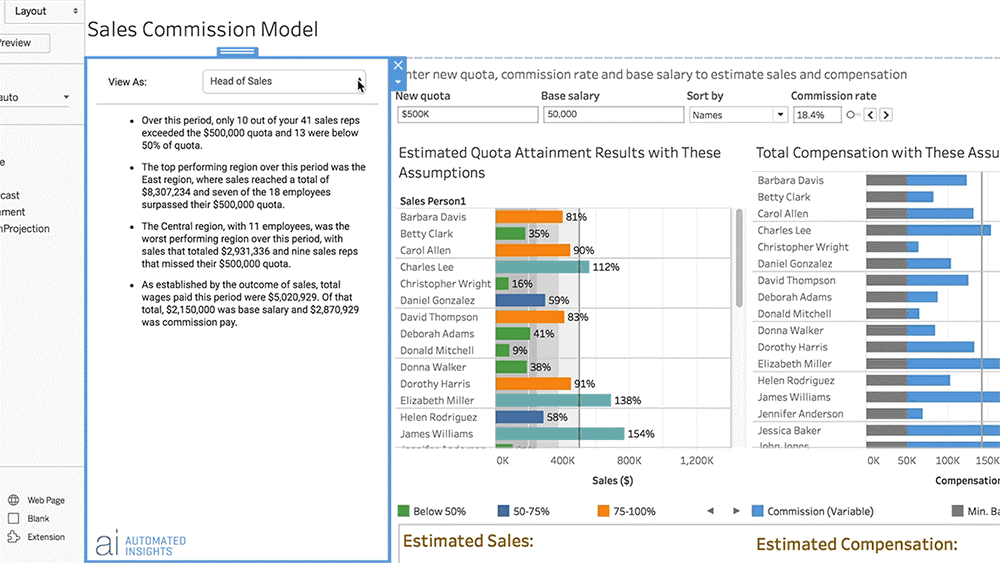
If you’re focused on telling a story, Wordsmith uses natural language generation to produce insightful narratives. This extension enables users to steer away from manual reporting, and instead pairs written analytics with data visualizations, in order to automatically set the template and transform the data of a dashboard. These written analytics can be modified based on the user’s role, whilst they can also be designated multiple languages. Wordsmith therefore creates a seamless process of communicating insights, and can make reporting and collaboration more efficient.
Tableau has provided an impressive list of initial extensions, with features such as Data-Driven Parameters and Date Updater assisting in the automation of data updates, and capabilities such as Dynamic Date Parameter and Filter Bookmarks enabling users to return to pre-determined default settings. But that doesn’t mean that developers haven’t already started joining in on the fun. For example, Bizstory have concentrated more on appearance, creating extensions such as Button and Image Filters which replace basic filter actions with...you guessed it!...buttons and images - making your dashboards look sleeker. Tableau wants developers to become as involved as possible, and recently launched the Tableau Developer Program, which provides free resources and opportunities for collaboration.
Although most of the reception regarding extensions has been positive, the feature is still relatively new so there are a few concerns that need to be mentioned. When integrating an extension on a dashboard, you essentially provide access to your data, which raises data protection issues. This is even more worrying if you consider that Tableau doesn’t inspect the extensions uploaded on the public gallery, nor conduct any risk evaluation. With literally anyone able to upload their extensions, how can you consider the source to be trustworthy?
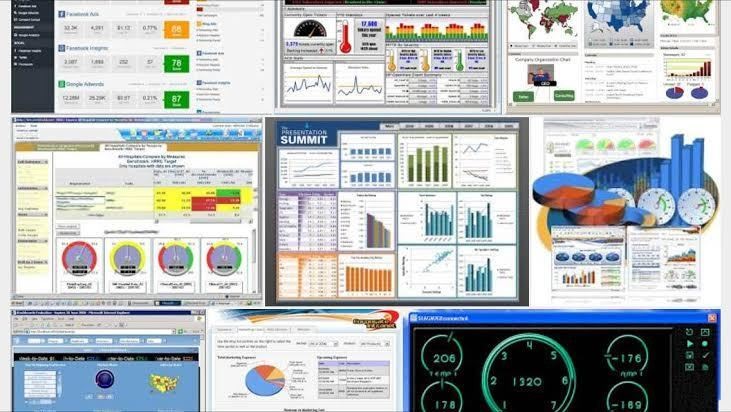
Extensions may also result in some visualization inconsistencies. Tableau concentrates as much on the science as it does on the appearance of dashboards, providing the most intuitive graphs and charts to satisfy users’ need. Through extensions, however, users could potentially implement unhelpful charts ,such as speedometers and, even worse, 3D charts, that would then make dashboards look clunky, inconsistent in design, and unattractive to their audience. What’s more, developers create extensions based on the latest version of Tableau, and with Tableau releasing multiple updates of their software tools per year, extensions can quickly become outdated. This can lead to major malfunctions, and developers might lack resources, or have insufficient time or opportunity to provide the necessary support.
As you can see, extensions offer Tableau users the ability to improve functionality and customization, but can also hinder safety and performance capabilities. Although the feature still needs some refinement and regulation from Tableau to avoid data leakage, we are excited to see how far this tool can evolve through the innovation and ingenuity of developers and are confident that in time it will prove to be an essential weapon for the Tableau community.


