TABLEAU TREND LINES: What are they and when should they be used.
Written by George Koursaros - 16-04-2018
What’s the causal effect of education on income? What’s the relationship between force and acceleration? What’s the impact of increased processing power on computing speed? Whether you come from the realm of data analysis or any other discipline, you have probably found yourself asking something along these lines before. As it happens, we are often interested in the relationship between variables because uncovering that relationship can provide us with great insight and valuable information. In Statistics, we can inform our understanding of these relationships using regression analysis; in Tableau, we do the same.
What are Trend Lines in Tableau?
Regression models, or trend lines as they’re called in Tableau, are statistical models that are used to estimate the trend or relationship between variables. They involve a dependent variable and one or more independent (explanatory) variables, whose impact on the dependent variable we are trying to uncover. In Tableau, there are five different types of trend lines that you should be aware of, which differ in terms of their form and suitability in different settings.
Let’s take a closer look!
For additional information please visit Tableau’s Trend Line Model Types documentation.
1: Linear Trend Lines
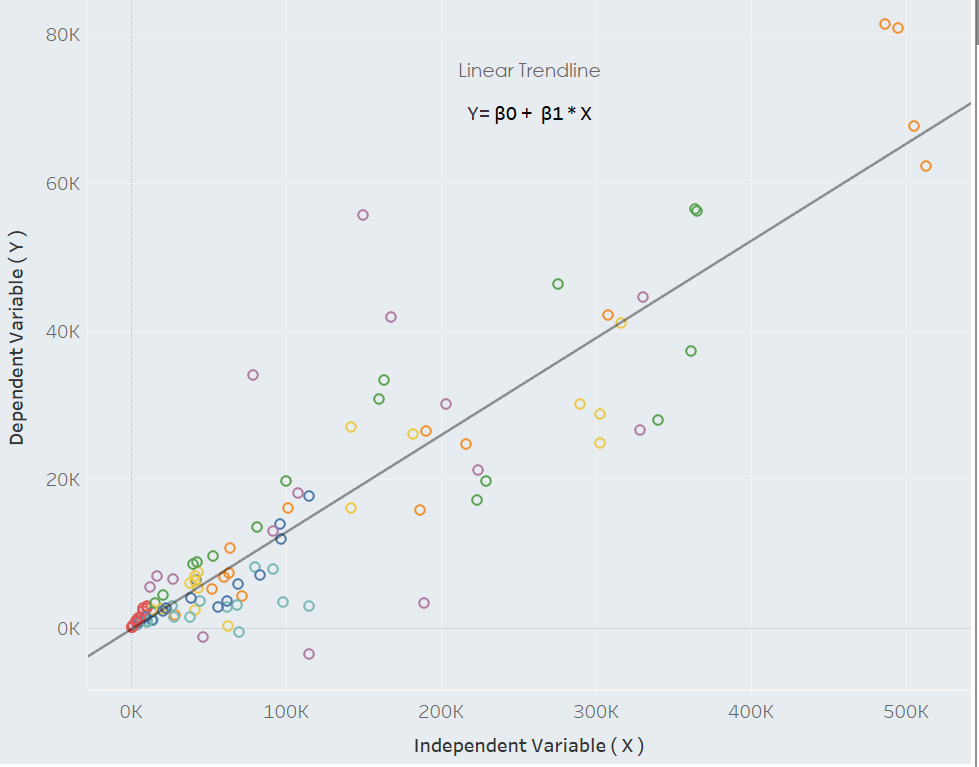
Linear trend lines are lines of best fit that are used to estimate a linear relationship in the data. They have the following form:
where Y is the dependent variable that we are interested in and X is the independent variable that affects it. They represent the simplest trend line model in that they are estimating a relationship that is increasing or decreasing at a steady rate β1 and are therefore best used when the trend of the data resembles a linear pattern.
Example: The cost of products tends to be linear. If one apple costs $1 then five apples will cost $5.
2: Logarithmic Trend Lines
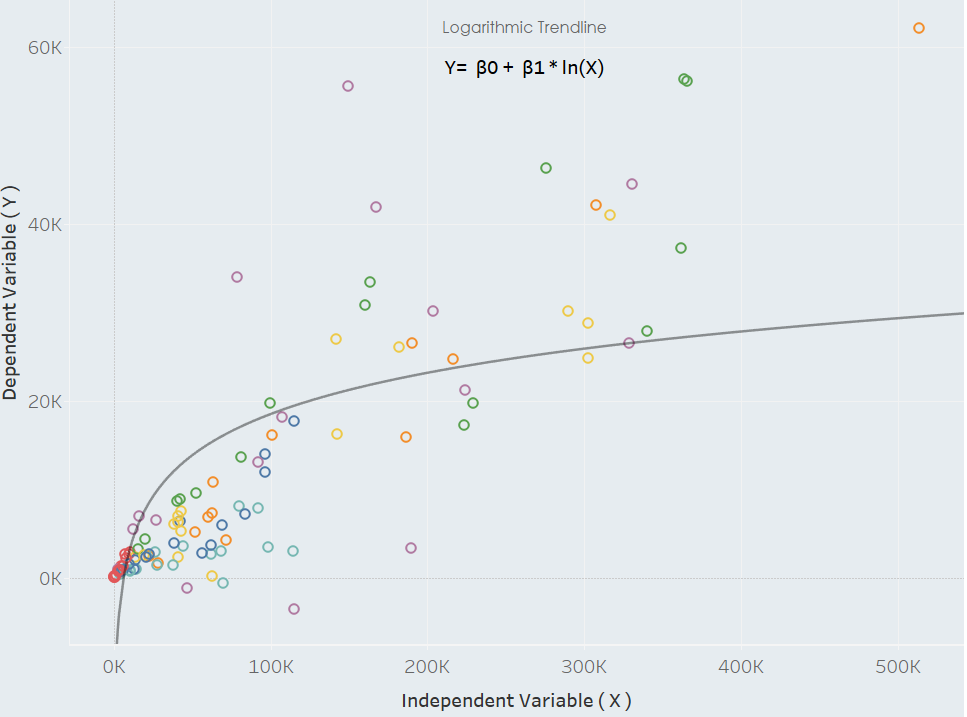
Logarithmic trend lines are curved lines of best fit that should be used when the rate of change between variables increases or decreases quickly but gradually levels out. They are given by
where ln(X) is the natural logarithm of X.
Since this quantity is not defined for negative values of X, any marks with values below 0 for the independent variable will be filtered before the trend line is estimated. Logarithmic trend lines should therefore be avoided in situations where a considerable portion of the marks contain negative values for the field in the columns shelf.
Example: Learning a new skill as a function of time. Improvements come quickly for a novice chess player; they come very slowly for a chess grandmaster.
3: Exponential Trend Lines
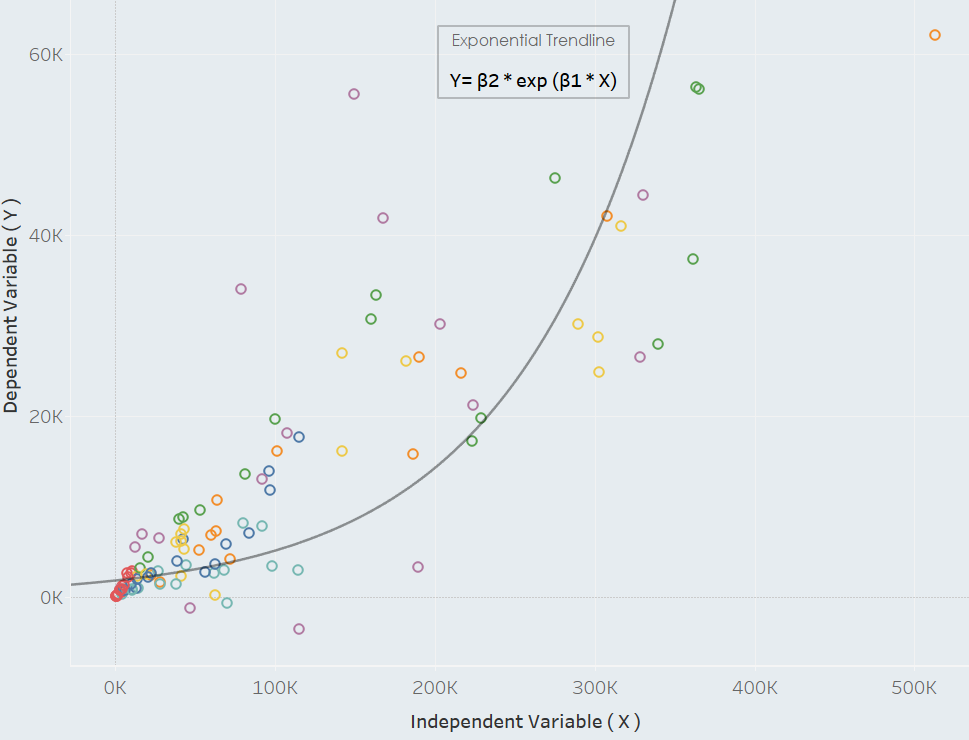
Exponential trend lines are curved lines of best fit that are most suitable when the rate of change between variables rises at increasingly higher rates. They have the following form
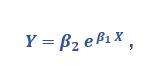
where ![]() . In the exponential model, the dependent variable is first transformed by the natural logarithm ln(Y) before the model is estimated. As before, since this quantity is not defined for negative values of Y the model should be avoided in situations where the field on the rows shelf contains many negative values, since these marks will be filtered out.
. In the exponential model, the dependent variable is first transformed by the natural logarithm ln(Y) before the model is estimated. As before, since this quantity is not defined for negative values of Y the model should be avoided in situations where the field on the rows shelf contains many negative values, since these marks will be filtered out.
Example: Spread of a Virus. Assuming no immunization, one infected person can infect multiple new people and the virus is spread exponentially.
4: Power Trend Lines
Note: Power trend lines are a feature made available in Tableau 10.5, not supported by earlier versions.
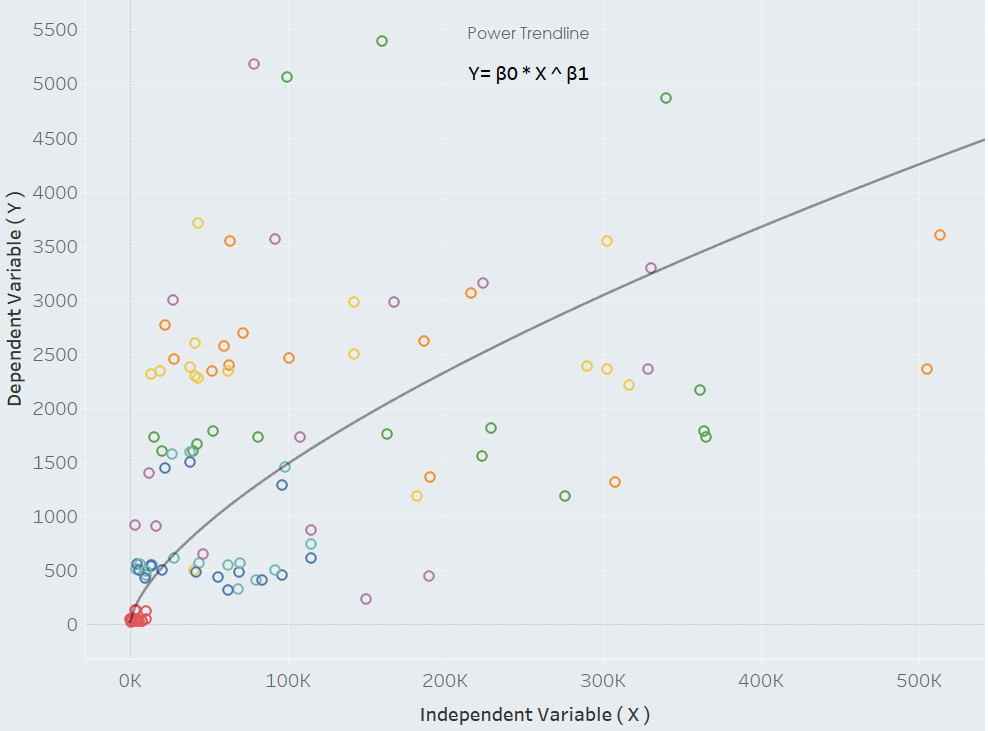
Power trend lines are curved lines that are most appropriately used when the dependent variable increases at a predetermined rate β_1. They are characterized by the following equation.
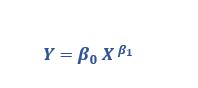
In the power model, both variables are transformed by the natural logarithm ln(Y), ln(X) before the model is estimated. Since these quantities are not defined for negative values, any marks with negative values in either variable will be filtered out. Power trend lines should be used with caution to avoid information loss.
Example: Acceleration of a train. The distance in meters covered as seconds go by increases at a predetermined rate; that is the train’s acceleration.
5: Polynomial Trend Lines
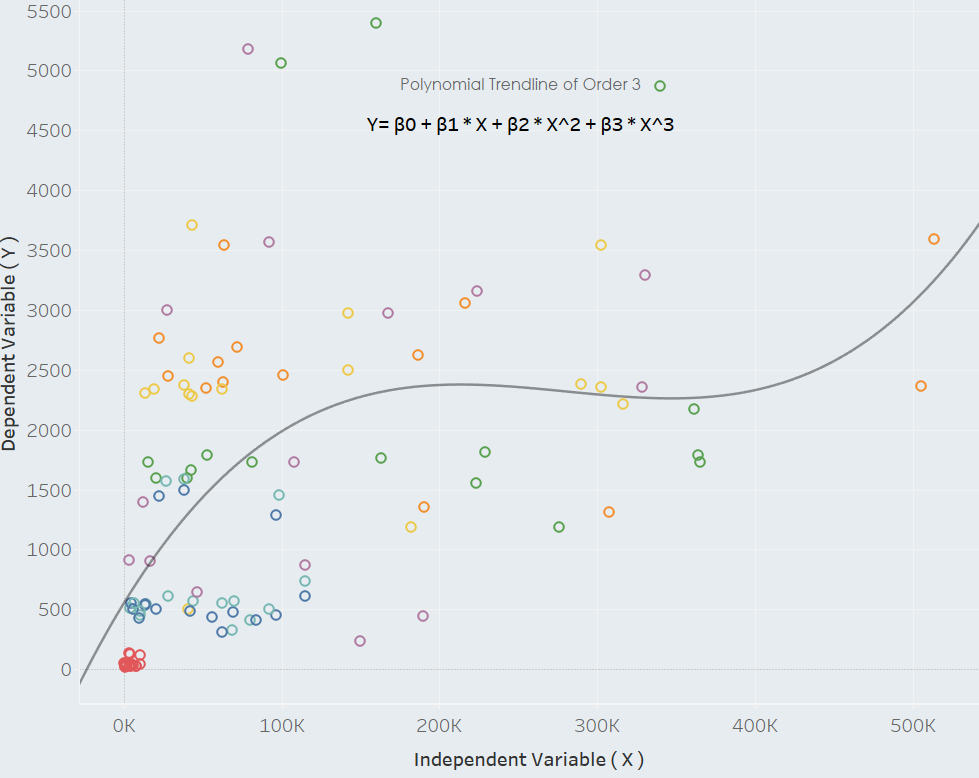
Polynomial trend lines are curved lines that are most suitable when dealing with variables that have a fluctuating relationship. This is because they can flexibly assume different shapes depending on the user-defined order of the polynomial which in Tableau can take values from 2 to 8. The polynomial equation has the following form
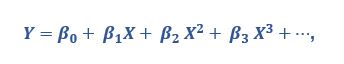
where the last term in the sequence has an exponent equal to the order. In practice, a simple heuristic for deciding the polynomial order is to identify how many fluctuations or “bends” appear in the data. In the example that follows you can see two bends (maxima and minima) because the polynomial is of order 3.
Example: Trajectory of a kicked ball over time. The height reached by a ball over time is a polynomial of order 2, a parabola!
How to Add Trend Lines
Note: Since to plot a trend line we require a Scatter (XY) plot, in Tableau we need at least one numeric field on the rows shelf and one numeric field on the columns shelf. This includes date fields since time can be interpreted as a numeric value.
As with everything else in Tableau, adding a trend line is as simple as a “drag and drop”. Given that the existing view supports the use of a trend line (see note above) you can add a trend line from the analytics pane.
You simply drag Trend Line into the view and drop it on any of the five model types we’ve discussed previously.
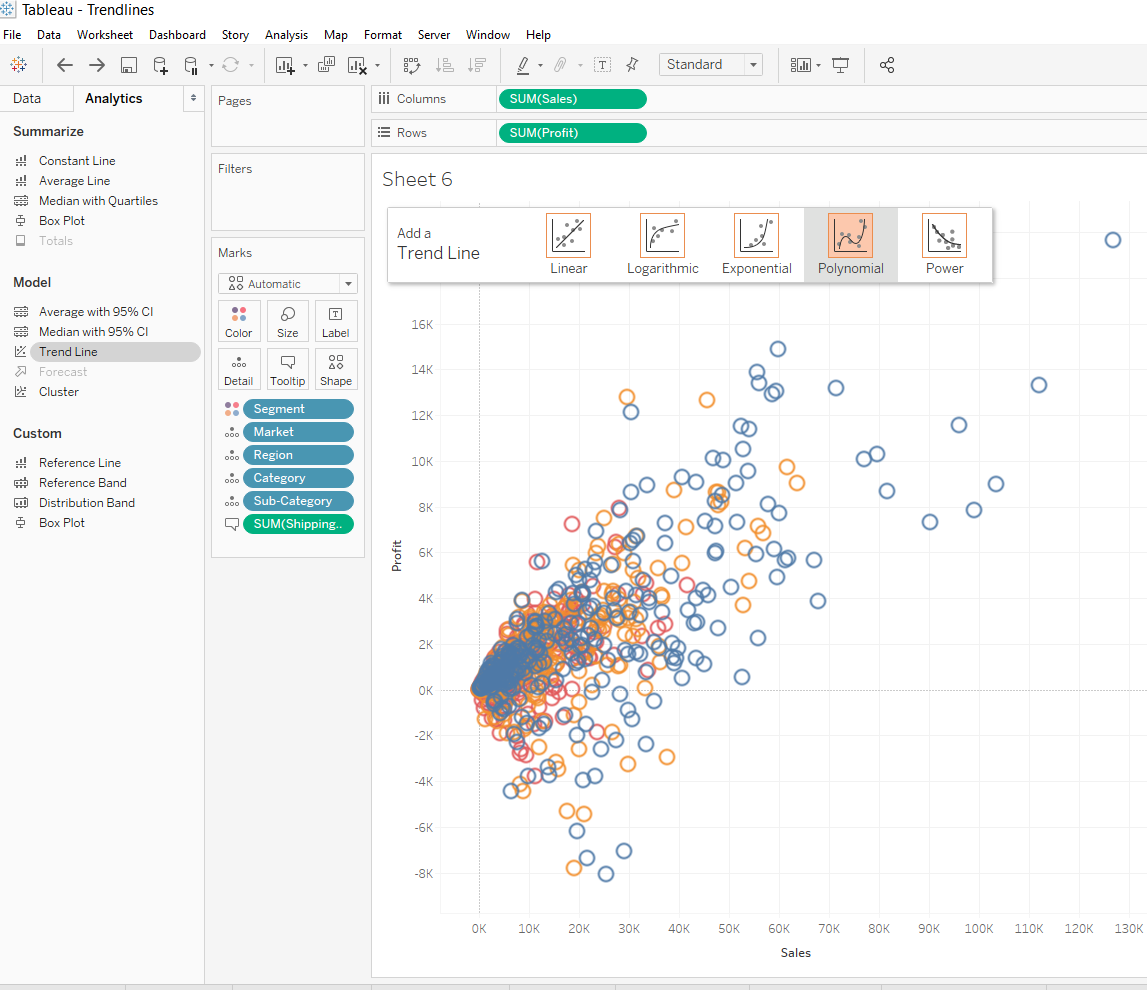
Tableau will automatically add a trend line for every color, pane and page present in the view. In case something doesn’t look quite as it should, no need to panic; you can easily edit your worries away.
How to Edit Trend Lines
To edit, simply right-click on a trend line and select Edit Trend Lines. This will bring up the Trend Lines Options dialogue box.
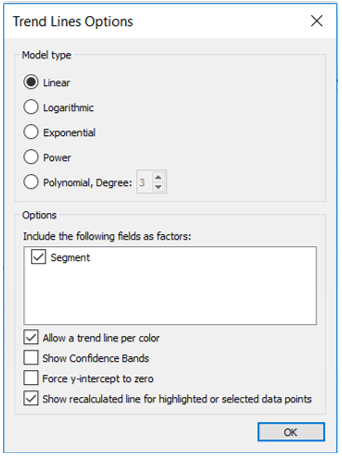
Here you can decide what Model Type to use and what fields to include as factors for the estimation of the trend line or otherwise put, the scope of the trend line.
For more information on which factors to include please visit Tableau’s Removing Factors from the Model documentation.
Beyond that, there are a few more goodies in the bag! You can decide whether you want:
• a trend line estimated for every color in the view.
• the upper and lower 95% confidence lines showing.
• the trend line to go through the origin.
• a trend line being recalculated when you highlight or select data points.
How Good is my Trend Line?
So, you’ve managed to plot a trend line and edit it to your liking. A natural question to ask next is what does my trend line tell me?
To answer that we must look at the description of the model, which we can access by either hovering over the trend line or by right-clicking on it and then choosing Describe Trend Line or Describe Trend Model. Each of these options provides different levels of description with the latter being the most detailed and showing the entire regression table.

Here, amongst other information, you can find the exact trend line formula, the p-values and the R-squared which is a measure of how well the trend line fits to the data. As a general rule of thumb, a low p-value (usually less than 0.005) signifies a good model. The best indicator of model performance is the R-squared statistic which ranges between 0 and 1. The closer it is to 1 the higher the explanatory power of the trend line and the better the fit of the model to the data.
For additional information on p-values click here.
For additional information on R-squared click here.
Closing Thoughts
The truth is that you can’t always tell with absolute confidence which trend line will be the best fit in advance. The magic of Tableau is that you can try all of them with a few clicks and make the decision empirically, no scripts or coding required.
And having read this article, you are now equipped with the essential tools needed to carry out trend line analyses! What other trend line features do you think would be a good addition? Which other trend line models would you like to see in future versions?